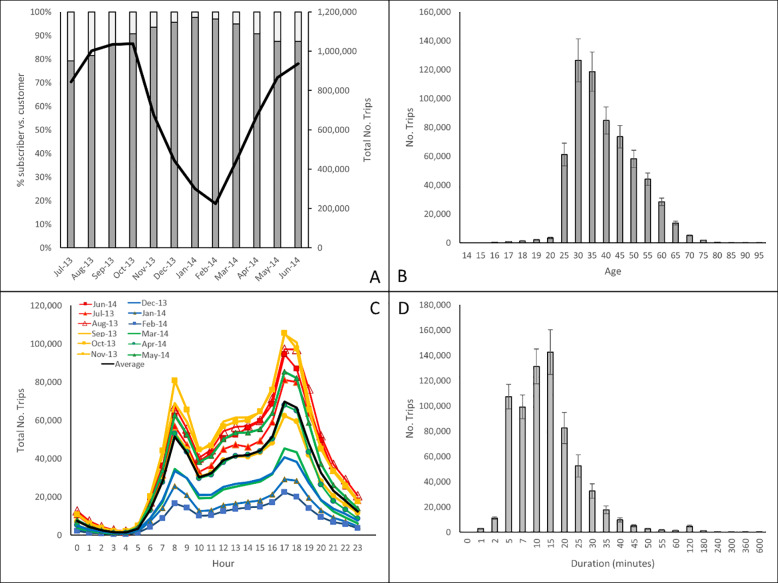
Fig 2.
Breakdown of bike trips between July 2013 and June 2014 by (A) customer (subscriber (grey bars) vs customer (white bars); total number of trips (solid black line)), (B) age (+/-SE), (C) time of day (blue = winter months, red = summer months, green = spring months, brown/yellow = autumn months, black line = average) and (D) duration (minutes) (+/-SE).

