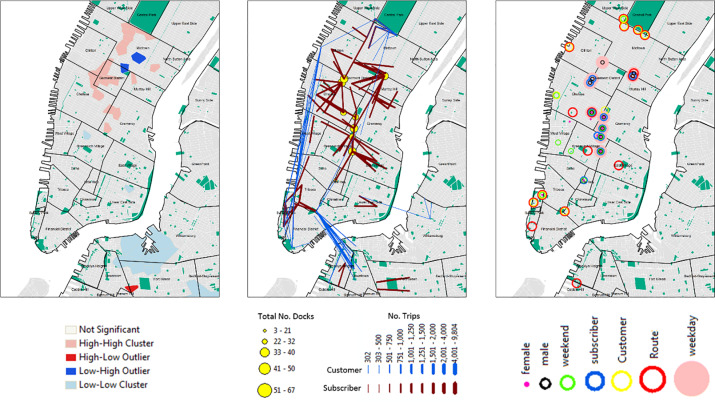
Fig 4.
(A) Distribution of bike stations and clustering of bikes (based on total number of docks at each bike station); (B) most popular start locations (showing the top 10 start stations) and origin-destinations (top 100 routes used by subscribers and customers); and (C) top ten start stations by gender (male and female), user type (subscriber and customer), day of the week (weekend (Saturday and Sunday) and weekday (Monday through Friday)) and route. (Data Sources: CitiBike Stations, NYC Parks, Census Blocks, NYC Neighborhood Names (S2 Table)).

