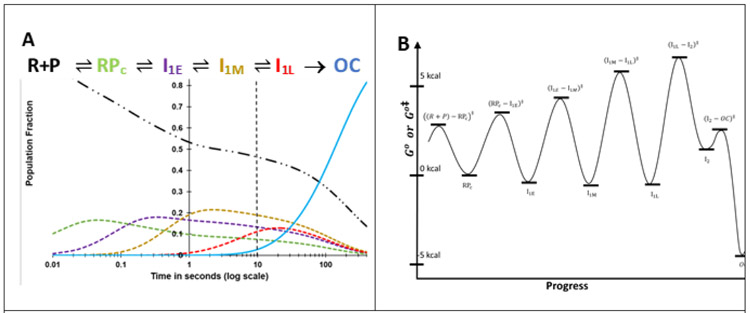
Figure 8. A) Time Evolution of Populations of Unbound Promoter DNA, Intermediates in the {CC} Ensemble and the Stable λPR Promoter OC.
Simulations of population fractions of reactant, intermediates and product vs time (0.01 s to 400 s) for 5-step Mechanism 2 at 50 nM final concentrations of RNAP and promoter DNA, 19 ° C, using rate constants (Table 3) from analysis of FRET and PIFE kinetic data. Free promoter DNA — .. –; closed complex intermediates RPC – – –, I1,E – – – , I1M– – – , I1,L – – –, OC ──. The dashed vertical line at 10 s marks the onset of OC formation from the equilibrium mixture of {CC} and free promoter DNA predicted from filter binding and MnO4− kinetic data (Fig. 2B). B) Standard Free Energy (G°) vs. Progress Diagram for OC Formation with FL λPR Promoter DNA. G° values for CC intermediates and the stable OC are obtained from the equilibrium constants of Table 3 (ΔG° = −RT lnKi) and are expressed relative to RPC, which is arbitrarily assigned G° = 0 kcal. The G° value for I2 is obtained from K5 = k5/k−5, where k−5 = 1.2 s−1 (see Fig. 5, there designated kI2 → I1). Activation free energies Go‡ relative to the same reference are calculated from the relationship ΔGo‡ = − RTln(k/k max) where kmax is the (maximum) rate constant for the hypothetical situation ΔGo‡ = 0.4 For purposes of illustration, we choose kmax= 5 x 10³ s−1 for all steps.

