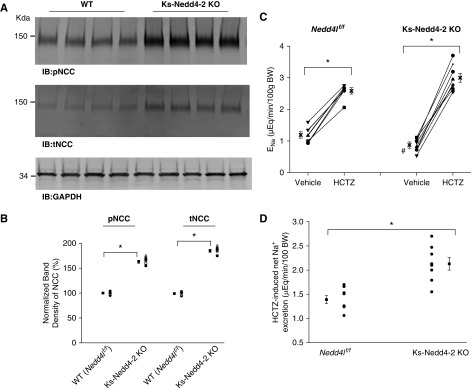
Figure 3.
Deletion of Nedd4-2 stimulates NCC. (A) An immunoblot showing the expression of pNCC and tNCC in WT and Ks-Nedd4-2 KO mice. GAPDH, glyceraldehyde-3-phosphate dehydrogenase; IB, immunoblot. (B) A scatter graph summarizes the normalized band intensity of the above experiments for pNCC and tNCC, respectively. The mean value and SEM are shown on the left of each row. (C) A scatter line graph showing the results of each experiment in which the effect of single-dose HCTZ (30 mg/kg body wt [BW]) on urinary Na+ excretion (ENa) within 120 minutes was measured with the renal clearance method in WT (Nedd4lflox/flox) and Ks-Nedd4-2 KO mice. (D) A scatter plot showing Δ values of HCTZ-induced net changes in ENa. *Significant difference (P=0.05) determined by t test; #significant difference of the basal ENa between WT (Nedd4lf/f) and Ks-Nedd4-2 KO mice.

