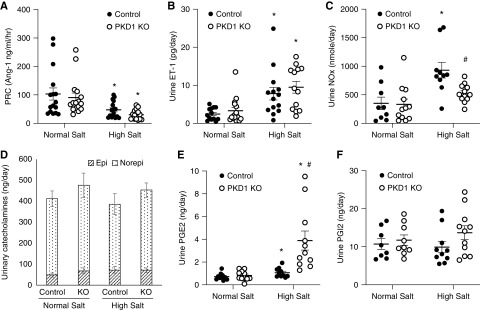
Figure 4.
Effect of normal Na+ and high Na+ intake (day 2 of high Na+ diet) on (A) PRC, (B) urine ET-1 excretion, (C) urine nitrite/nitrate excretion, (D) urinary catecholamines, (E) urine PG E2 excretion, and (F) urine PGI2 excretion in control and Pkd1 KO mice; n=10–16 each data point except n=8 for catecholamines. Epi, epinephrine; Norepi, NE. *P=0.05 high Na+ versus normal Na+ within the same genotype; #P=0.05 KO versus control on the same Na+ intake.

