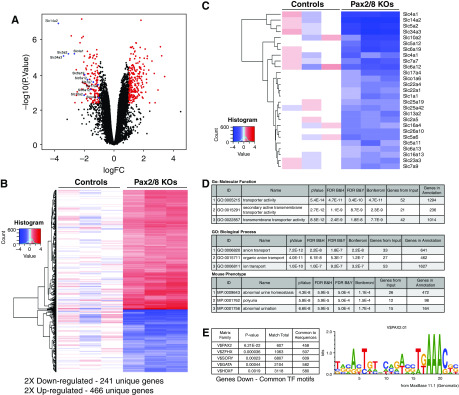
Figure 3.
Gene expression analysis of Pax2/8 mutant kidneys. (A) Volcano plot of Affymetrix gene array comparisons between control (n=3) and Pax2/8 KOs (n=3) using total kidney RNA. (B) Heat map and clustering of 241 genes downregulated (blue) and 466 genes upregulated (red) in Pax2/8 KOs. Gene symbols and fold change are available in Supplemental Table 1. (C) Heat map of genes encoding the solute carrier family of transmembrane transporters that are downregulated in Pax2/8 KOs. (D) Gene Ontology analyses of genes downregulated in Pax2/8 KOs, using the Toppgene suite.25 The gene list reduced in KOs shows strong correlation with ion transporters and urine concentration. (E) Common transcription factor motifs (TFs) found in the genes downregulated in Pax2/8 KOs and in genes upregulated in Pax2/8 KOs. The top 5 TFs are shown, the most significant by far being the Pax2 family found in genes downregulated. The Pax2 DNA-binding matrix common to most genes downregulated in the mutants is shown. V$IRFF, interferon regulatory factors; V$MYT1, C2H2 zinc finger proteins; V$SORY, Sox/Sry HMG Box proteins; V$SP1F, GC-Box factor Sp1; V$ZFHX, Zinc Finger homeodomain.

