Figure 1.
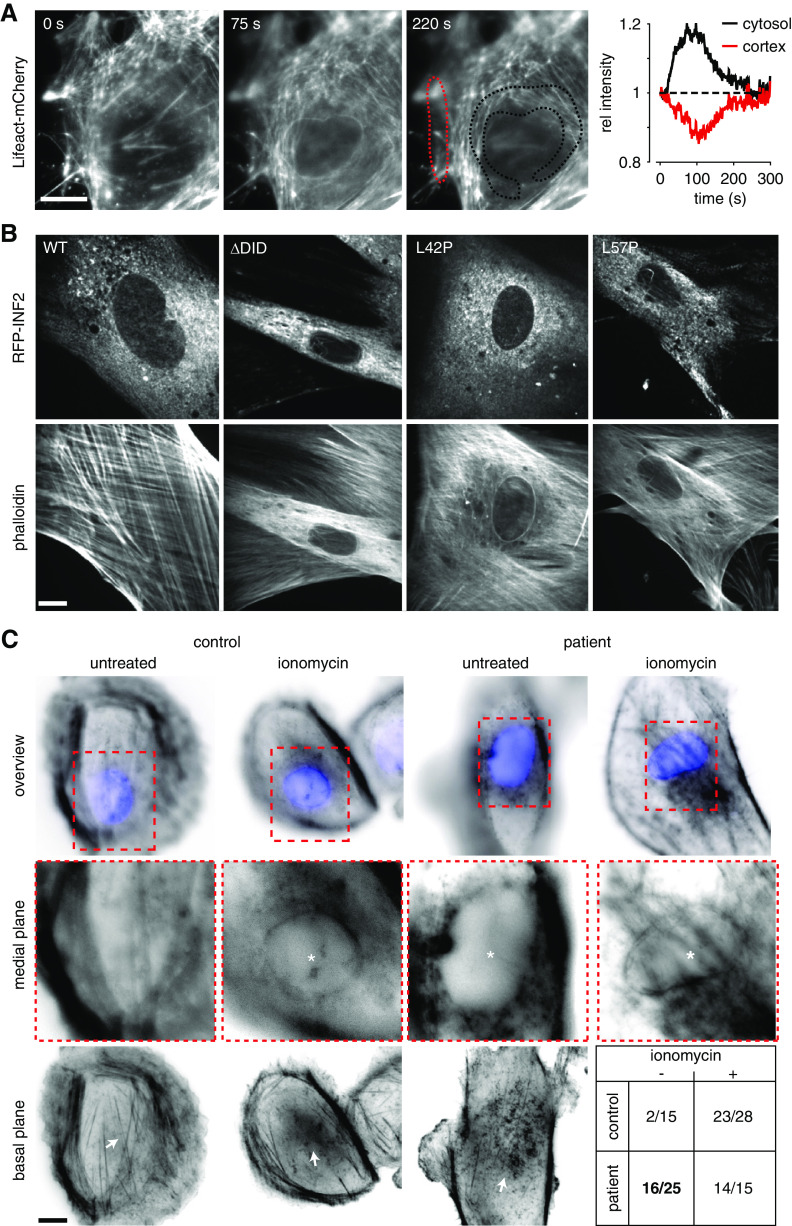
INF2 mediates actin reorganization in primary cells. (A) Time-lapse imaging of isolated primary mouse podocytes transfected with Lifeact-mCherry and treated with 500 nM ionomycin at t=0. Dotted lines delineate regions used for intensity plots. (B) Images of primary mouse podocytes transfected with indicated RFP-INF2 constructs, PFA-fixed and stained with Alexa Fluor 350-labeled phalloidin. (C) Cells isolated from urine samples obtained from a healthy control and a patient with FSGS (INF2 L162P), treated with 500 nM ionomycin for 1 minute, PFA-fixed and stained with Alexa Fluor 594-labeled phalloidin and DAPI. Images were taken at the focal plane of the nucleus. Asterisks indicate cells with intracellular actin polymerization. Arrows indicate changes in actin distribution on the basal surface of the cells (note that fewer stress fibers are present in both ionomycin-treated cells and in patient cells before the application of ionomycin). Table in lower right corner indicates number of cells with perinuclear actin (per total number) in indicated conditions. Scale bars, 10 µm.

