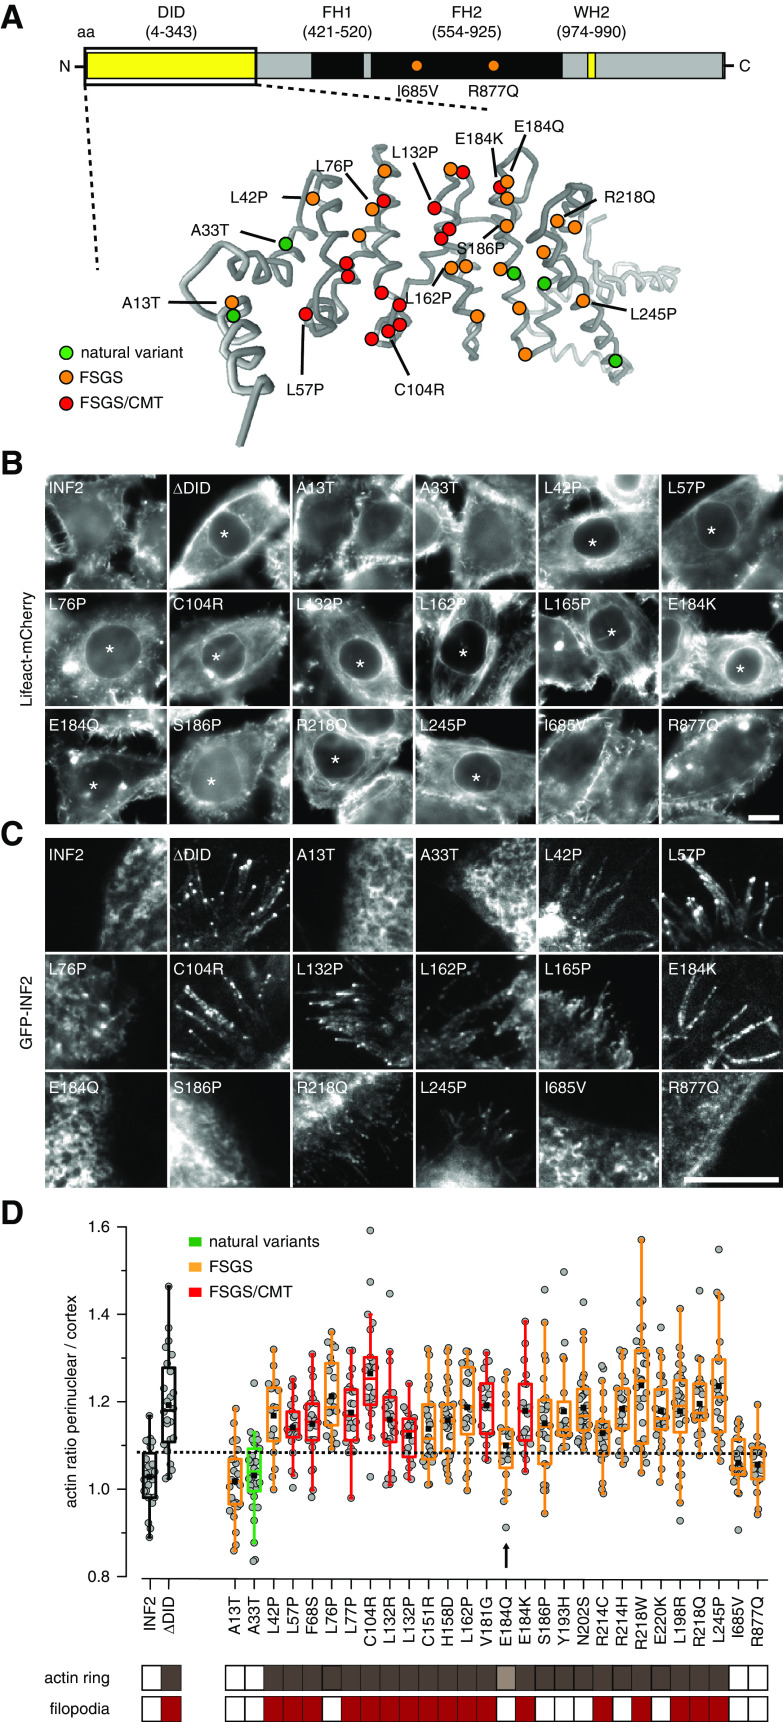
Figure 2.
Systematic evaluation of the effects of INF2 mutations on actin organization. (A) Overview of INF2 domains and structural model of the INF2 DID domain (amino acids 1–343) generated by Phyre.2 Amino acid substitutions caused by missense mutations are indicated in green, orange, and red for benign variants, FSGS-only, and FSGS/CMT-linked mutations, respectively. (B and C) Epifluorescence images of HeLa INF2 KO cells stably expressing Lifeact-mCherry after transfection with the indicated GFP-tagged INF2 constructs. Images in (C) were acquired by total internal reflection fluoresecence (TIRF) microscopy to visualize basal GFP-INF2 localization. Asterisks indicate cells with perinuclear actin ring. (D) Quantification of perinuclear-to-cortical actin intensity ratios. Cells expressing INF2 wt and INF2 ΔDID were used as positive and negative controls, respectively (black boxes). Benign INF2 variants, FSGS-only, and FSGS/CMT-linked mutations are labeled in green, orange, and red, respectively. The dashed line indicates the mean+2 SD of the wt value. Classification of cells exhibiting intracellular actin rings (brown boxes) and/or filopodia-like structures (red boxes) is shown. Arrow and light brown box indicate INF2 E184Q variant with intermediate actin reorganization. Scale bars, 10 µm.

