Figure 3.
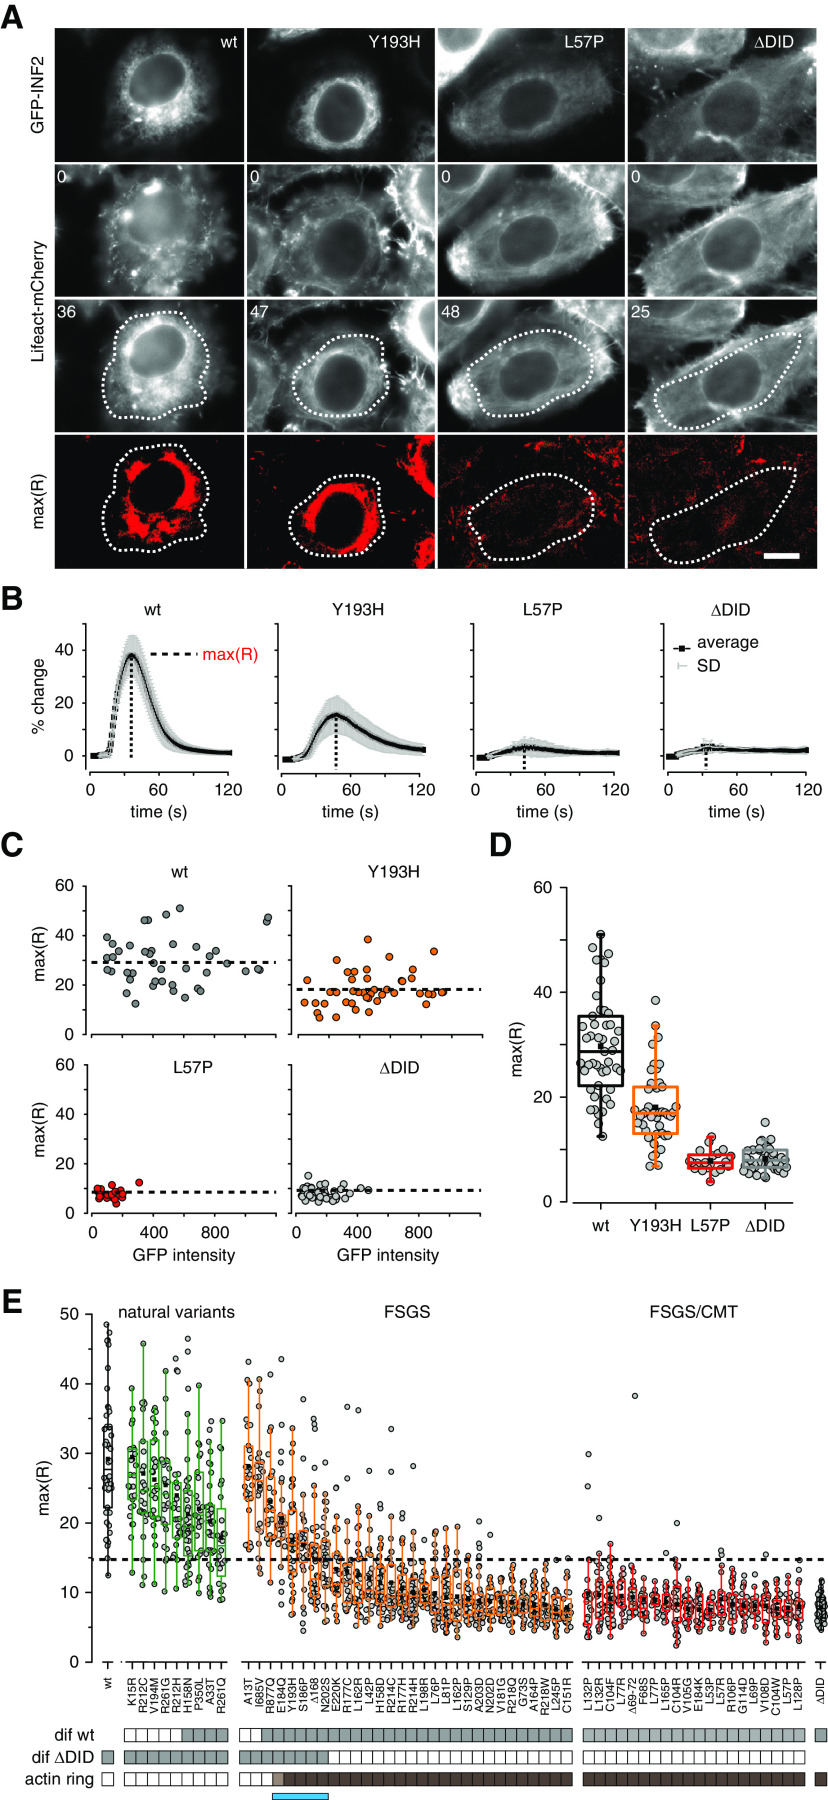
Quantitative analysis of the functionality of INF2 mutant proteins on the basis of the CaAR assay. (A) HeLa INF2 KO cells stably expressing Lifeact-mCherry were transfected with the indicated GFP-INF2 constructs. We then monitored actin organization in cells after laser-induced calcium influx at t=8 seconds. Images depict actin organization in cells at t=0 second and at the time point of maximal actin reorganization. Regions used for intensity measurements in (B) are delineated by dashed lines. Scale bar, 10 µm; times are given in seconds. (B) Kinetics of actin reorganization observed in (A), given in terms of percent change (mean±SD). (C) Graphs of maximal actin reorganization values max(R) for cells expressing the indicated GFP-INF2 constructs, plotted against average fluorescence intensities of the respective GFP-INF2 variant. Dashed line represents mean of all max(R) for given variant. (D) Box plots of max(R) values in (C). (E) Box plots of max(R) values for all analyzed INF2 mutations (n≥21). INF2 wt and ΔDID were used as positive and negative controls (black boxes), respectively. Benign INF2 variants, FSGS-only, and FSGS/CMT-linked mutations are labeled in green, orange, and red, respectively. Values are ordered first by the type of INF2 mutation and then by how much they differ from the ΔDID value (largest to smallest). Gray boxes below the graph indicate that max(R) values were significantly different relative to either wt or ΔDID (one-way ANOVA test with Holm–Bonferroni post hoc correction). Brown boxes indicate GFP-INF2 expression leading to actin reorganization at t=0 second (see also Figure 2D). The blue bar indicates the group of INF2 variants with intermediate actin reorganization phenotypes.

