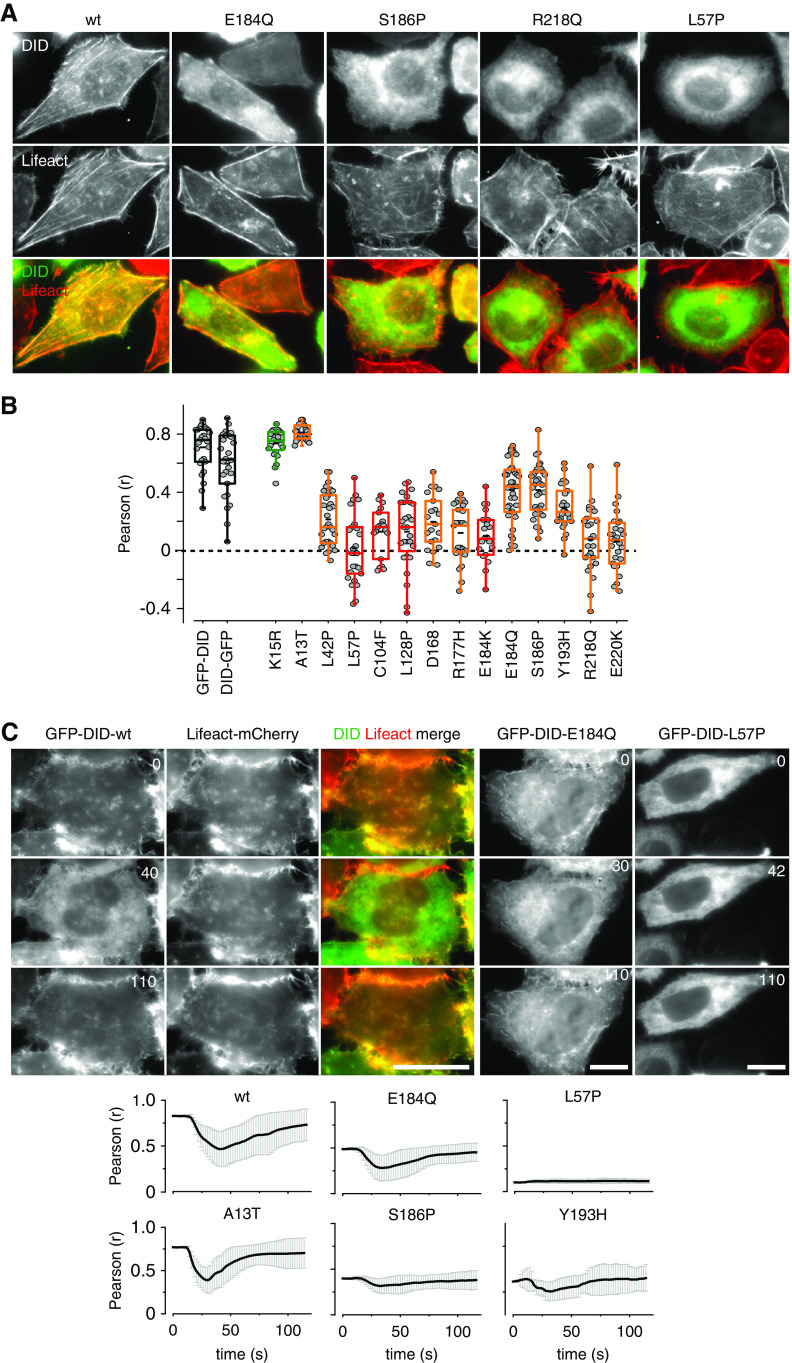
Figure 5.
Subcellular localization of the INF2 DID domain. (A) HeLa INF2 KO cells stably expressing Lifeact-mCherry were transfected with the indicated GFP-INF2 DID domain constructs (aa 1–420) and analyzed for GFP-INF2 DID localization. (B) Quantification of colocalization of wt (black boxes), benign (green), FSGS-linked only (orange), and FSGS/CMT-linked GFP-INF2 DID variants (red) with Lifeact-mCherry was quantified by Pearson correlation coefficient (r) for n≥20 cells. (C) Kinetics of GFP-INF2 DID relocalization from actin structures to the cytosol after calcium stimulation, as indicated by the Pearson correlation coefficient (r) of time lapse images with respect to image at t=0 second. Scale bars, 10 µm.

