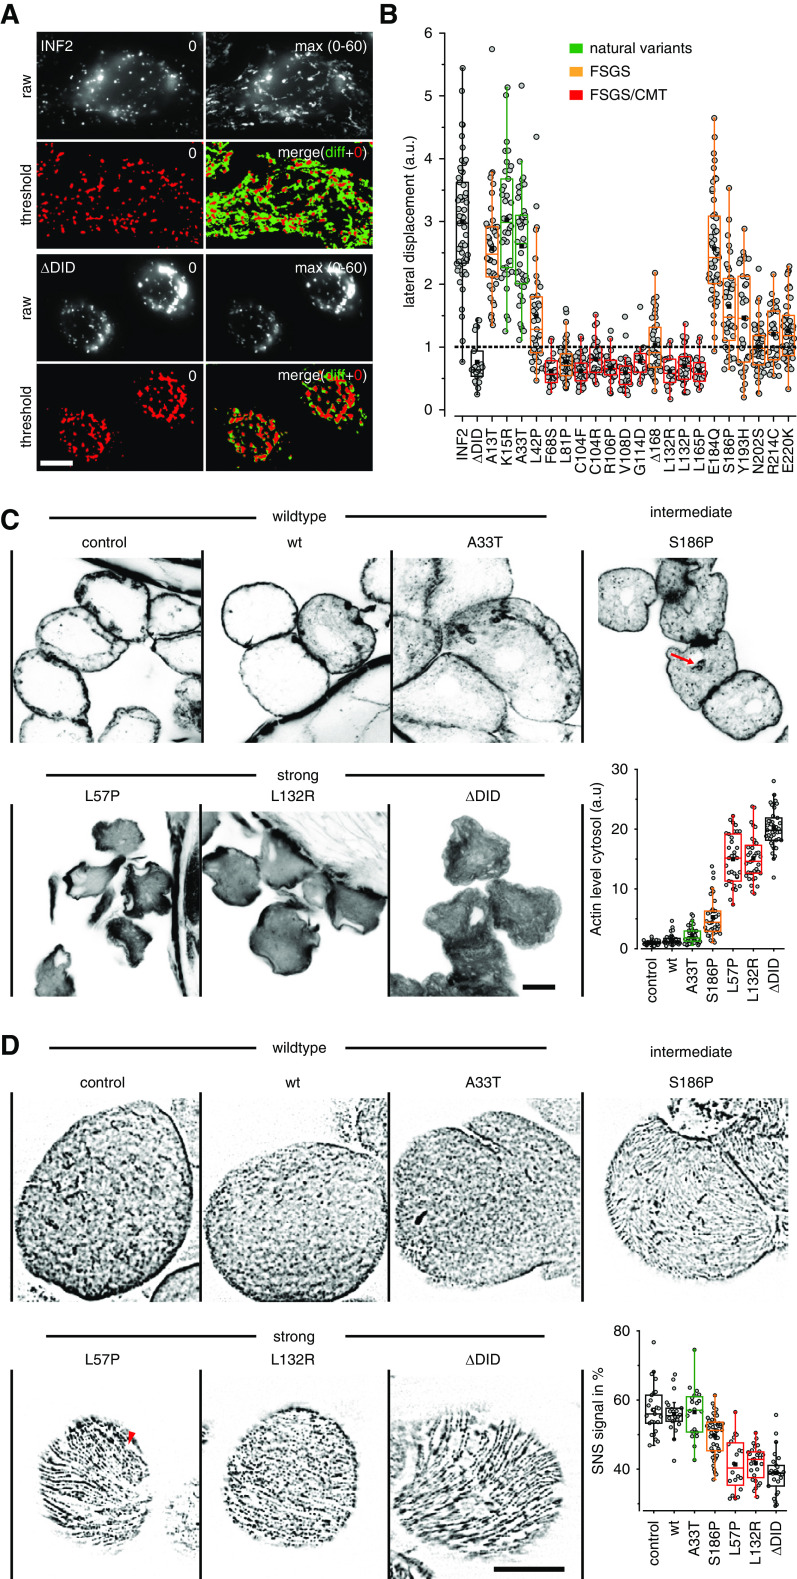
Figure 6.
Physiologic consequences of disease-linked INF2 mutations. (A and B) HeLa INF2 KO cells were transfected with the indicated GFP-INF2 constructs, stained with LysoTracker red and monitored for the indicated periods. To analyze the distribution of lysosomes in cells, images were thresholded at t=0 second (red signal) and the area of lysosomal signal at t=0 second (red in merged image) was compared with the additional area occupied over the period covered by the image series (maximum intensity projection of t=0 to t=60 seconds minus t=0 seconds, green in merged image). Box plots in (B) indicate the relative change in the area covered by lysosomes in the course of 60 seconds, with one representing 100% area change (dashed line). wt GFP-INF2 and INF2 ΔDID were used as positive and negative controls (black boxes), respectively. Benign INF2 variants, FSGS, and FSGS/CMT-linked mutations are labeled in green, orange, and red, respectively. (C) Fly nephrocytes stably expressing the indicated Myc-tagged INF2 variants were formaldehyde fixed and stained with Alexa Fluor 647 phalloidin to analyze actin organization. Graph shows quantification of intracellular versus cortical actin (n≥31 cells). Images taken at midsection of nephrocytes. (D) Fly nephrocytes stably expressing the indicated Myc-INF2 mutants were heat fixed and analyzed for nephrin (Sns) localization using anti-Sns antibody. Images represent surface planes of shown nephrocytes. See Supplemental Figure 7 for medial sections. Graph shows quantification of nephrin density (n≥22 cells). Scale bars, 10 µm.

