Figure 4.
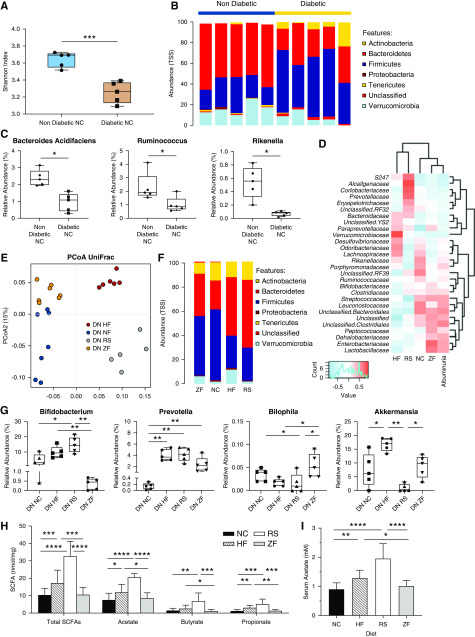
Diet-induced alterations in microbial ecology contribute to protection against DN through enrichment of SCFA-producing species. (A) Diabetes influences microbiota composition, with OTU-based α diversity metrics showing loss of diversity in diabetic versus nondiabetic mice (Shannon index). (B) Relative abundance of bacteria presented at the phylum level, depicting changes in microbiota composition in diabetic versus nondiabetic mice. (C) At the genus and species levels, diabetic mice had lower levels of known SCFA producing Ruminococcus, Rikenella genera, and bacteria from the Bacteroides acidifaciens species than nondiabetic controls. (E) Fecal microbiota composition was analyzed by 16S ribosomal RNA sequencing from feces of diabetic mice at 12 weeks. The composition of gut microbiota in diabetes is influenced by diet. Principal coordinates analysis using weighted UniFrac distances depicts significant differences in the composition of the gut microbiota between HF-, RS-, NC-, and ZF-fed diabetic mice (analysis of similarities P<0.001). (F) Distribution of OTUs (key) in feces from diabetic mice fed different diets (horizontal axis); each OTU is presented as relative abundance at the phylum level. (G) RS and HF feeding ameliorates disease-related dysbiosis, resulting in expansion of the SCFA-producing Prevotella and Bifidobacterium genera, with relative reduction in pathobiont Bilophila. RS and HF diets had contrasting effects on relative abundance of Akkermansia. (D) Pearson correlation-based heatmap at a family level, identifying the bacteria associated with severity of albuminuria, with cool colors representing negative correlation and hot colors representing positive correlations. (H and I) Quantification of SCFA levels in feces and serum from diabetic mice fed fiber supplemented (HF, RS), standard (NC), or deplete (ZF) diets by 1H NMR spectroscopy. Data are shown as means±SD with a minimum of five mice per group; *P<0.05; **P<0.01; ***P<0.001; ****P<0.0001.

