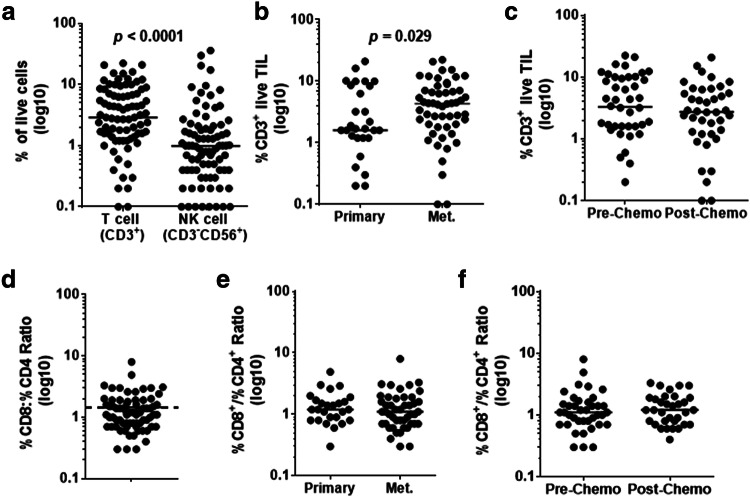
Fig. 1.
Characterization of lymphocyte infiltrate in primary/metastatic and pre/post-chemo OvCa samples. a T cell (CD3+) and NK cell (CD3−CD56+) infiltration is compared within the live lymphocyte population using flow cytometry, with the horizontal bar representing the median value of each population (n = 84). T cell (CD3+) infiltration is compared between b primary and metastatic sites, and c pre- and post-chemo samples, with the horizontal bars indicating the median value (n = 84). d The ratio of CD8+ to CD4+ % T cells within the CD3+ compartment is displayed. The dotted line indicates where a ratio of 1 is in relation to the average ratio which is represented by the solid horizontal line (n = 72). The CD8/CD4 ratio is compared between e primary and metastatic sites and f pre- and post-chemo samples, with the horizontal bars indicating the median value (n = 72). Samples that had less than 100 cells within the CD8 and CD4 gates were excluded from analysis

