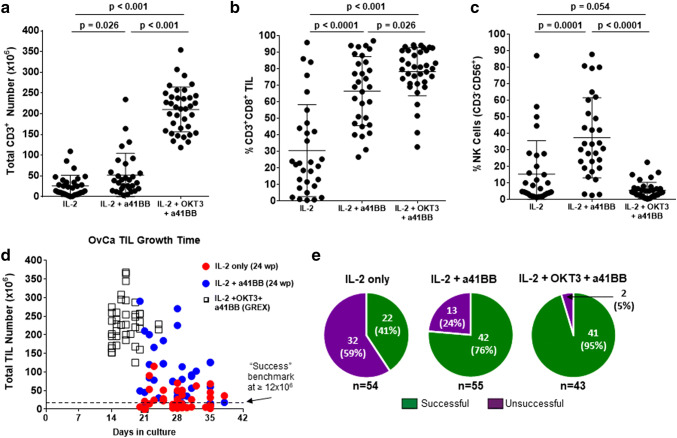
Fig. 2.
Characterization of TIL growth across culture conditions. Comparison of the a total CD3+ TIL number, b percentage of CD3+CD8+ TIL, and c percentage of NK cells generated between the different culture methods. Samples in IL-2 and IL-2 + a41BB conditions are paired (n = 30) while samples in IL-2 + OKT3 + a41BB are unpaired (n = 36). For a–c, only samples that grew are shown. Some samples are not shown due to dropout after QC. The horizontal bars indicate the mean value and SD are shown for each population. Comparison between culture methods of the d time of culture and e success rate of growth for all attempted cultures. In e, IL-2 + a41BB has 55 samples because one sample was set up without an IL-2 only counterpart culture

