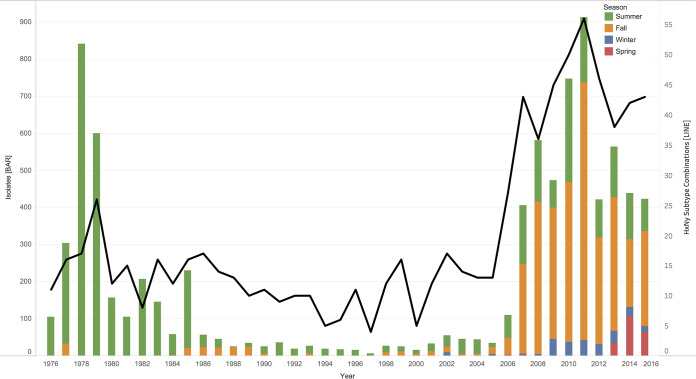
FIG 6.
Stacked bars representing IAV isolates per year from waterfowl sampled in North America between 1976 and 2015, stratified by season sampled (3-month intervals; summer: June to August). The black line indicates subtype diversity, calculated by the number of distinct subtype combinations detected each year. Expansion of IAV surveillance efforts to locations associated with fall migration, winter, and spring migration led to higher diversity of IAV subtypes recovered than in years with predominant summer sampling.

