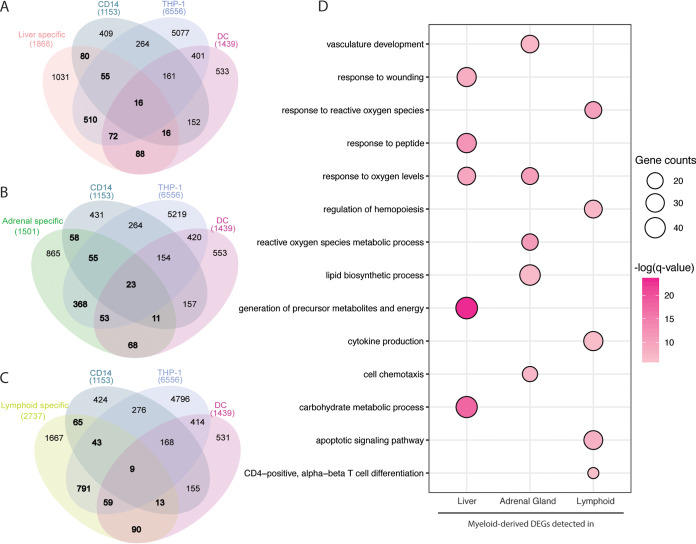
FIG 10.
A significant number of liver, adrenal, and lymphoid tissue DEGs originate from myeloid cells. (A to C) Venn diagrams depicting the comparison of tissue-specific DEGs and those detected in CD14+ monocytes obtained from infected macaques as well as in vitro-infected THP-1 and monocyte-derived dendritic cells in (A) liver, (B) adrenal gland, (C) and lymphoid tissues. (D) Bubble plot representing functional enrichment of myeloid-derived DEGs detected in liver, adrenal gland, and lymphoid tissues. The size of the bubbles represents gene counts for each GO process. The colors represent the levels of significance relative to each GO process.

