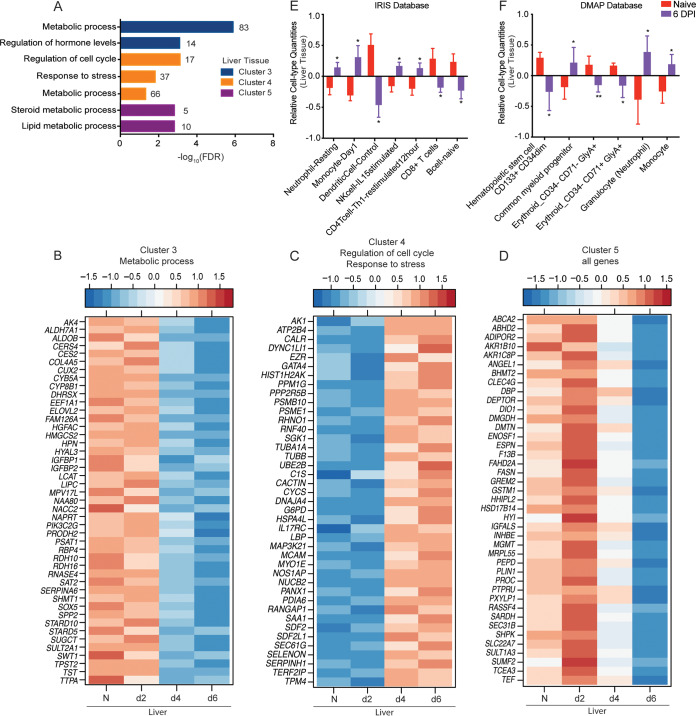
FIG 3.
Liver-specific DEGs play a role in metabolism and cell cycle. (A) Functional enrichment of liver DEGs within clusters 3, 4, and 5 determined using MetaCore. The bar graph indicates the –log10 FDR-corrected P value. The numbers next to the bars indicate the number of genes that mapped to each of the GO terms. (B to D) Heatmaps of genes in cluster 3 that enriched to “metabolic process” (B), genes in cluster 4 that enriched to “regulation of cell cycle” and “response to stress” (C), and all DEGs within cluster 5 (D). Each column represents the median normalized transcript counts (RPKM) for each gene at each time point as follows: N (naive; n = 4), d2 (2 DPI; n = 4), d4 (4 DPI n = 2); d6 (6 DPI; n = 4). The range of colors is based on scaled and centered RPKM values of the entire set of genes, with red indicating highly expressed genes and blue indicating lowly expressed genes. (D and E) Bar graph depicting the mean ± SD of immune-cell type frequencies predicted using ImmQuant software using the IRIS (D) and DMAP (E) databases in naive samples (n = 4) and those obtained 6 DPI (n = 4). Significance between naive and 6 DPI samples was determined using unpaired two-tailed t test with Welch’s correction. *, P < 0.05; **, P < 0.01; ***, P < 0.001.

