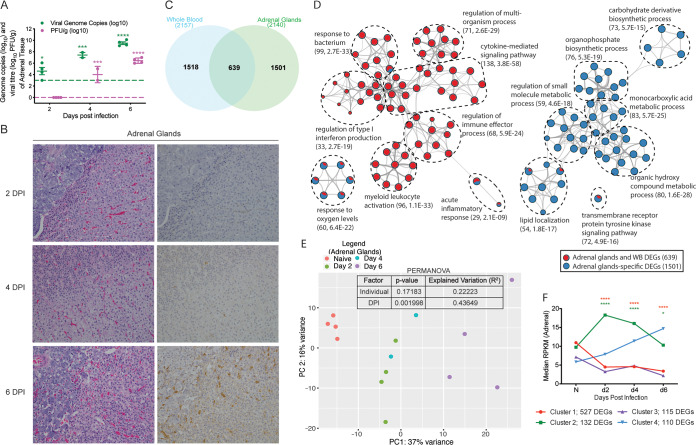
FIG 4.
Makona infection results in significant organ damage and transcriptional changes in the adrenal gland. (A) Mean ± SD of EBOV infectious virus titer and genome copy numbers in adrenal gland were quantified using a plaque assay and RT-qPCR for each animal and each time point. Significance was determined using one-way ANOVA with Dunnett’s multiple-comparison test relative to the limit of detection, which is represented as a dashed line. *, P < 0.05; ***, P < 0.001; ****, P < 0.0001. (B) Hematoxylin and eosin staining (left) and immunohistochemistry staining (right) (brown indicates reactivity) using anti-VP40-specific antibody of adrenal glands at 2, 4, and 6 DPI; ×20 magnification. (C) Venn diagram comparing differentially expressed genes (DEGs) detected in whole blood (WB) and adrenal gland pooled DEGs from all time points. (D) Network image showing functional enrichment of DEGs detected in both adrenal glands and WB, and adrenal-specific DEGs using Metascape and visualized using Cytoscape. Each circle represents a theme of highly related gene ontology (GO) terms. The edges (lines) link similar GO terms, and the thickness of the lines indicates the relatedness of the GO terms. Each GO term is shown as a pie chart that depicts the relative transcriptional contribution of DEGs detected in both adrenal gland and WB (red) and adrenal gland only (blue). (E) Principal component analysis (PCA) of adrenal gland-specific DEGs over time. (F) STEM analysis identified four distinct and significant temporal expression clusters of genes. The median RPKM of each cluster over time is plotted. The Bonferroni-corrected P values for each cluster in order are 4.67e-14, 7.37e-5, 3.00e-4, and 1.66e-4. Statistical significance between time points was determined using one-way ANOVA with Dunnett’s multiple-comparison test relative to N (naive). *, P < 0.05; ****, P < 0.0001.

