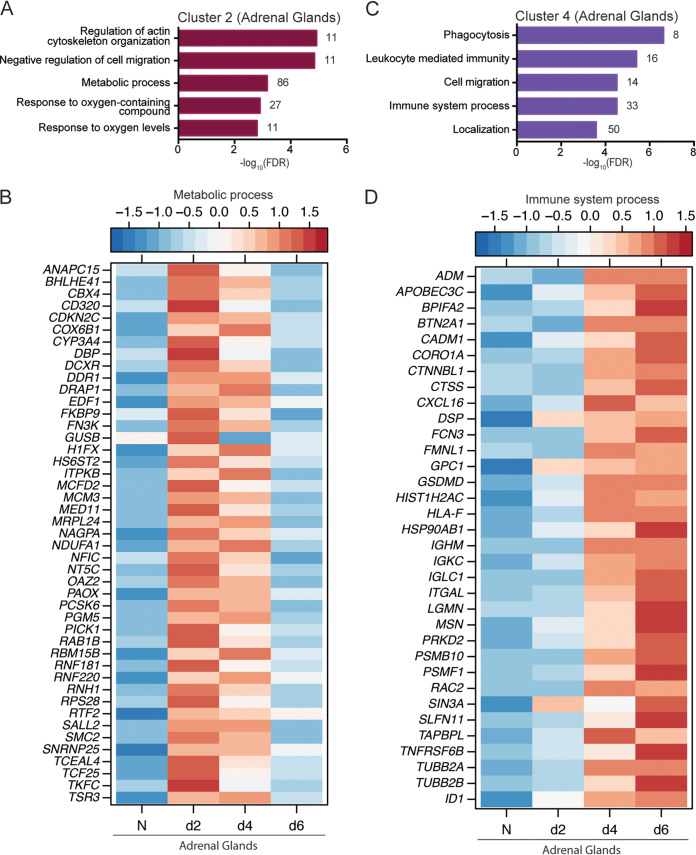
FIG 6.
Adrenal-gland specific DEGs play a role in metabolism and immunity. (A and C) Functional enrichment of adrenal gland-specific DEGs within cluster 2 (A) and cluster 4 (C) generated using MetaCore. The bar graph indicates the –log10 FDR-corrected P value. Numbers next to the bars indicate the number of genes that mapped to each of the GO terms. (B and D) Heatmap of DEGs within cluster 2 that enriched to the GO term “metabolic process” (B) and DEGs in cluster 4 that enriched to the GO term “immune system process” (D). Each column represents the median normalized transcript counts (RPKM) for each gene at each time point as follows: N (naive; n = 4), d2 (2 DPI; n = 4); d4 (4 DPI; n = 2), d6 (6 DPI; n = 4). The range of colors is based on scaled and centered RPKM values of the entire set of genes, with red indicating highly expressed genes and blue indicating lowly expressed genes.

