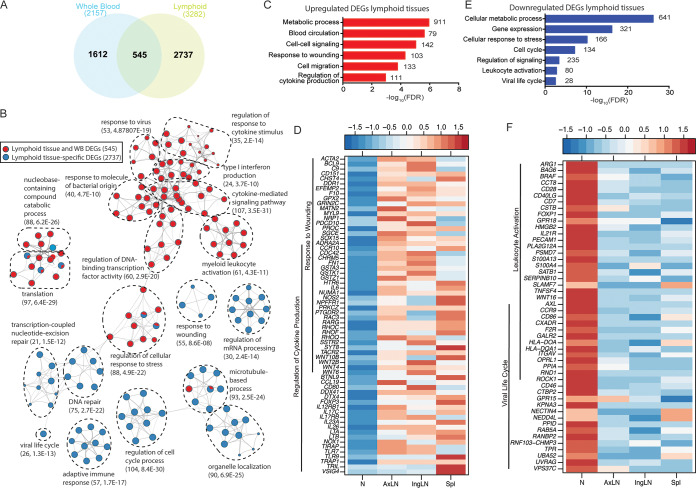
FIG 8.
Transcriptional changes in lymphoid tissues are associated with metabolism, regulation of gene expression, inflammation, and lymphopenia. (A) Venn diagram comparing pooled differentially expressed genes (DEGs) detected in whole blood (WB) and lymphoid tissues from all time points. (B) Network image showing functional enrichment of DEGs detected in both lymphoid tissues and WB and in lymphoid tissue only obtained using Metascape and visualized using Cytoscape. Each circle represents a theme of highly related gene ontology (GO) terms. The edges (lines) link similar GO terms, and the thickness of the line indicates the relatedness of the GO terms. Each GO term is shown as a pie chart that depicts the relative transcriptional contribution of DEGs detected in both lymphoid tissue and WB (red) and lymphoid tissue only (blue). (C and E) Functional enrichment of the upregulated (C) and downregulated (E) DEGs detected in lymphoid tissues was carried out using MetaCore. The bar graph indicates the –log10 FDR-corrected P value. Numbers next to the bars indicate the number of genes that mapped to each of the GO terms. (D and F) Heatmaps of upregulated (D) and downregulated (F) genes mapping to the indicated GO terms. Each column represents the median normalized transcript counts (RPKM) for each gene within each lymphoid organ: N (naive; n = 12), AxLN (axillary lymph node; n = 10), IngLN (inguinal lymph node; n = 10), Spl (spleen; n = 10). The range of colors is based on scaled and centered RPKM values of the entire set of genes, with red indicating highly expressed genes and blue indicating lowly expressed genes.

