FIG 9.
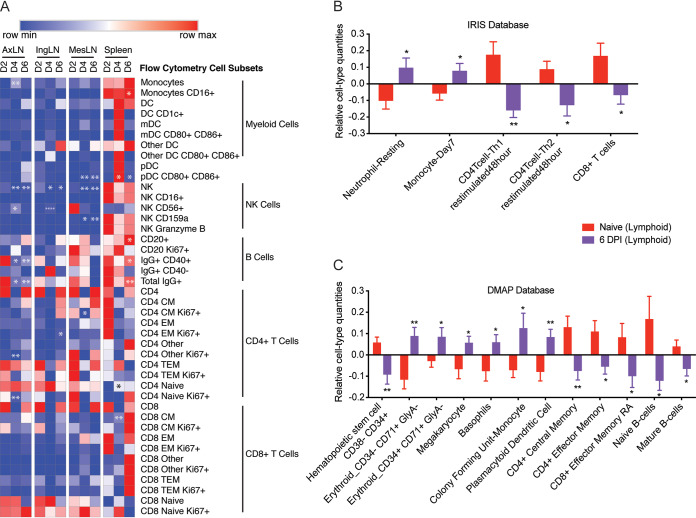
Immune cell frequencies within lymphoid tissues. (A) Heatmap of immune cell subset frequencies measured using flow cytometry. Each column indicates the median percentage frequency of the various subsets within each tissue. The range of colors is based on scaled row values of each cell subset, with red representing high cell frequency and blue representing low cell frequency. Significance was determined using one-way ANOVA relative to 2 DPI. *, P < 0.05; **, P < 0.01; ***, P < 0.01; ****, P < 0.0001. (B and C) Bar graph depicting mean ± SD immune-cell type frequencies predicted using ImmQuant software using the IRIS (B) and DMAP (C) databases in naive and 6 DPI samples. Significance was determined using unpaired two-tailed t test with Welch’s correction. *, P < 0.05; **, P < 0.01; ***, P < 0.001.

