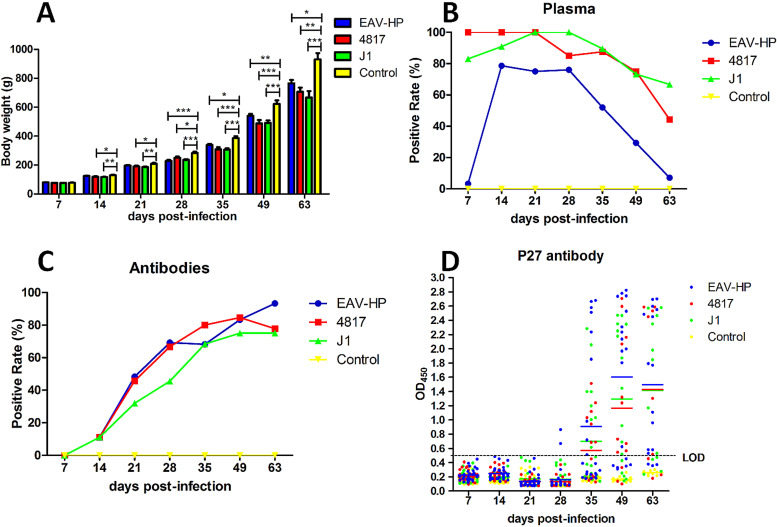
FIG 5.
Body weight loss, viremia, and antibody against ALV in infected chickens. The blue, red, green, and yellow columns or curves represent the EAV-HP, 4817, J1, and control groups, respectively. (A) Comparison of body weights measured at different time points. (B) Comparison of the viral positive rates in plasma from chickens infected with EAV-HP, 4817, and J1 viruses. (C) Comparison of positive rates for antibody against ALV from chickens infected with EAV-HP, 4817, and J1 viruses, determined by IFA. (D) Comparison of levels of antibody against ALV P27 from chickens infected with EAV-HP, 4817, and J1 viruses, determined by ELISA. Statistical analysis was performed with one-way ANOVA using GraphPad 5 software. A P value of <0.05 was considered significant. *, **, and *** indicate P values of less than 0.05, 0.01, and 0.001, respectively.

