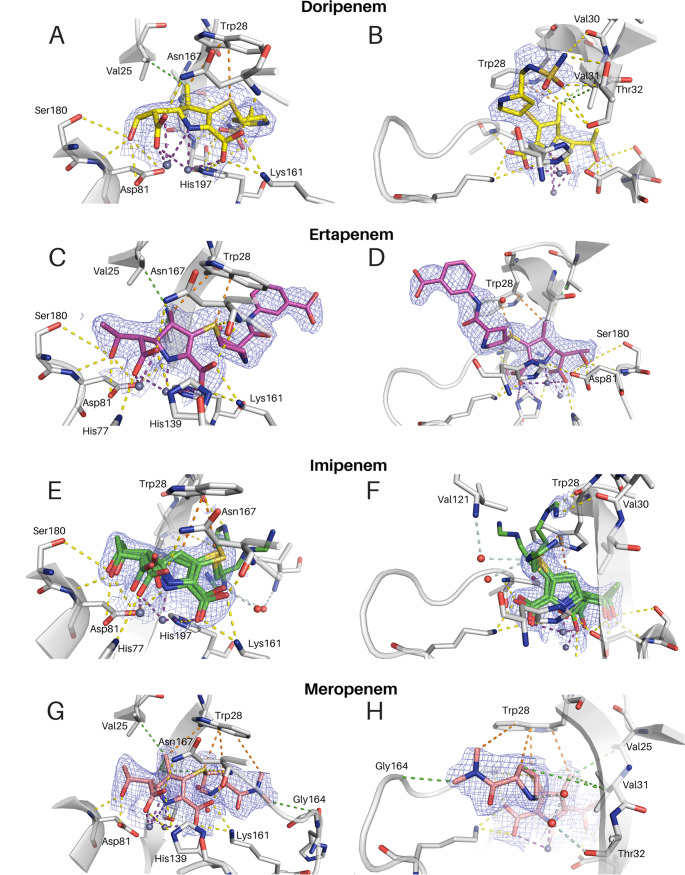
FIG 2.
2Fo − Fc maps at a contour level of 1σ for the presented complex crystal structures, showing interactions of the antibiotics’ carbapenem scaffold (A, C, E, G) and tails (B, D, F, H) with IMP-13. (E, F) Imipenem (green) shows three distinct tail conformations. All are depicted. (A to D, G, H) Doripenem (yellow) (A, B), ertapenem (magenta) (C, D), and meropenem (salmon) (G, H) are each seen in one conformation in each chain. Interactions are shown as dashed lines. Purple, zinc interactions; yellow, H bonds and charge-charge interactions; orange, aromatic interactions; green, hydrophobic interactions; pale blue, water network. Zinc ions are shown as gray spheres, and water molecules are shown as red spheres.

