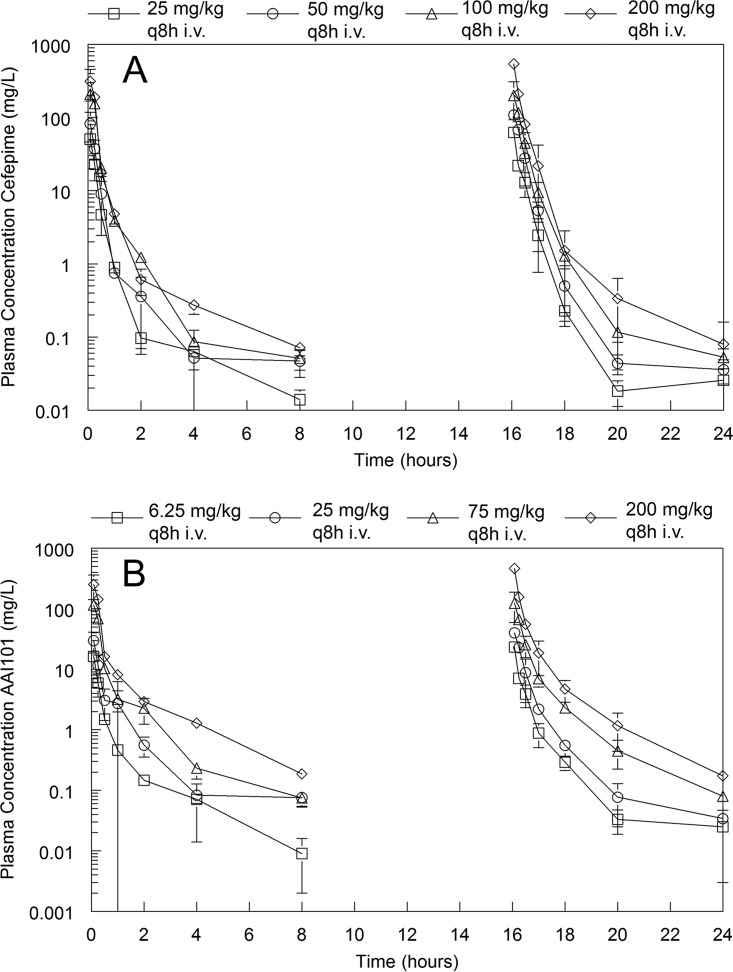
FIG 1.
Plasma PK profile for cefepime and enmetazobactam. (A and B) Total drug concentration-time profiles for cefepime (A) and enmetazobactam (B). Both drugs were coadministered i.v. at 0, 8, and 16 h with sampling in the 1st and 3rd intervals. A destructive design was used, with groups of mice at each dose-time point being serially sacrificed. Data are means ± standard deviations from 3 mice.

