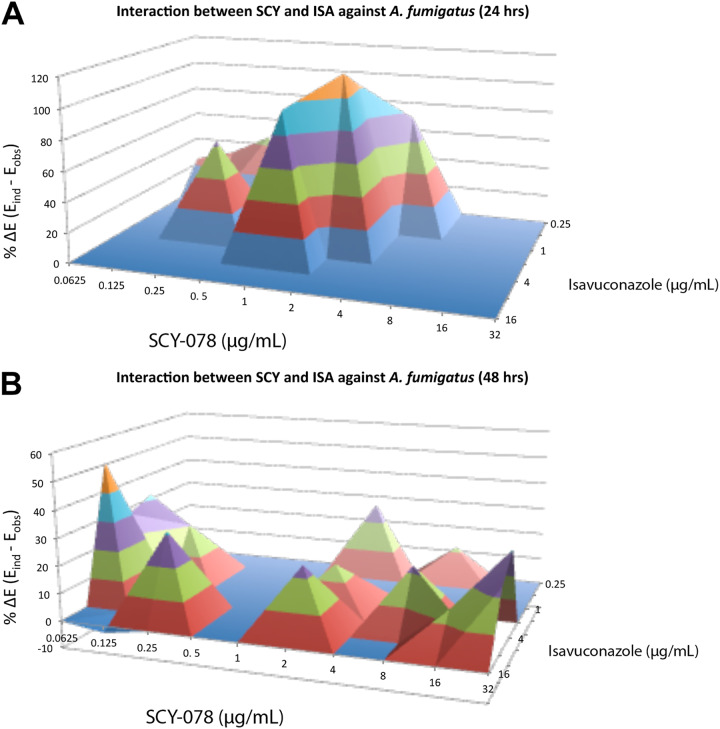
FIG 1.
Interaction surfaces obtained from response surface analysis of Bliss independence drug interaction model for the in vitro combination of ibrexafungerp and isavuconazole against A. fumigatus after 24 h (A) and 48 h (B) of incubation. The x and y axis are the concentrations of ibrexafungerp and isavuconazole, respectively. The z axis is the ΔE in percentage. The 0 plane represent Bliss independent interactions, whereas the volumes above the 0 plane represent statistically significantly synergistic (positive ΔE) interactions. The magnitude of interactions is directly related to ΔE. The different tones in the three-dimensional plots represent different percentile bands of synergy. The mean ΔE ± SEM was 68.9 ± 12.3% after 24 h and 25.2 ± 3.8% after 48 h.

