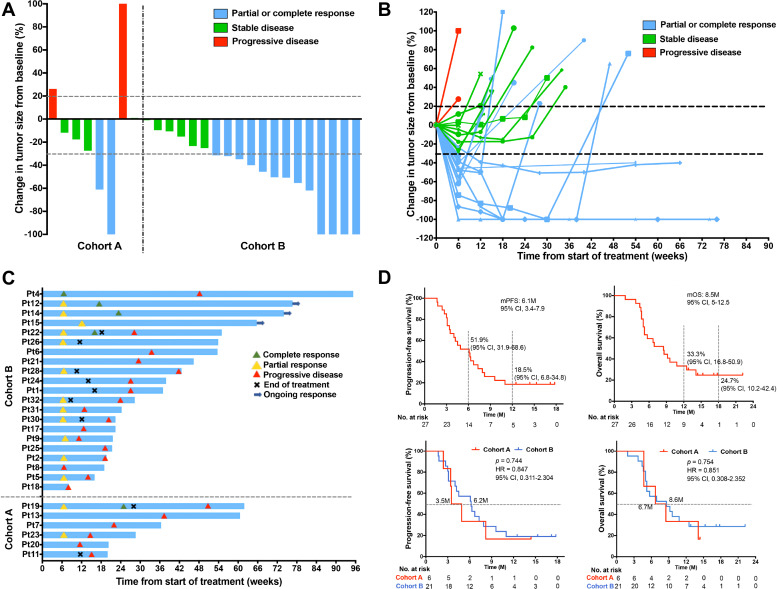
Figure 2.
Characteristics of clinical response and survival. (A) Highest percentage change in the change in target lesion size from baseline in patients from cohort A and cohort B; horizontal dotted lines denote a 30% decrease and 20% increase, indicating objective response and progressive disease, respectively, as per RECIST version 1.1. (B) Percentage change in target lesion tumor size from baseline over time for all evaluable patients, defined as those with baseline tumor assessments and at least one post-treatment assessment. The upper horizontal dotted line indicates disease progression at a 20% increase in the size of target lesions, and the lower dotted line represents an objective response at a 30% decrease in the size of target lesions. (C) Time to response and duration of response in patients from cohort A and cohort B. (D) Kaplan-Meier curves of investigator-assessed progression-free survival in all evaluable patients (upper left). Kaplan-Meier curves of investigator-assessed overall survival in all evaluable patients (upper right). Comparison of the median progression-free survival (mPFS) between cohort A and cohort B (low left). Comparison of the median overall survival (mOS) between cohort A and cohort B (low right). RECIST, Response Evaluation Criteria in Solid Tumors.

