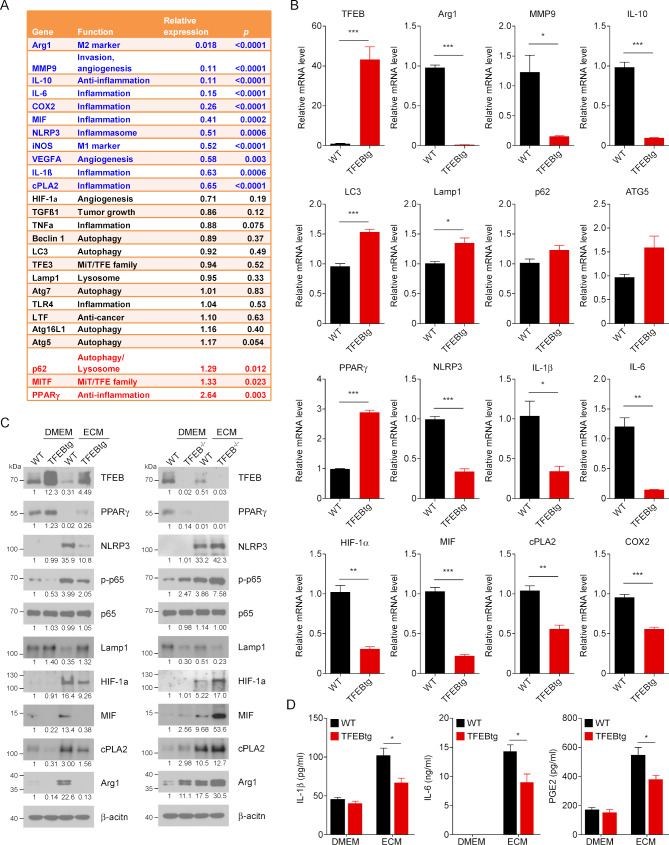
Figure 2.
Transcriptionfactor EB (TFEB) overexpression alters the gene expression profile in macrophages (MΦs). (A) Bone marrow–derived macrophages (BMDMs) from wild-type (WT) or MΦ-specific TFEB transgenic (MΦ-TFEBtg) mice were treated with Dulbecco’s modified Eagle medium (DMEM) or EO771 cell conditioned medium (ECM) for 24 hours; microarray was performed to analyze their gene expression profiles. A heatmap of genes differentially expressed in WT or TFEBtg is shown in online supplementary figure S2. A list of key genes that play roles in tumor-associated macrophage (TAM) functions is shown; relative expression means the ratio of the gene expression levels in TFEBtg MΦs compared with those in WT MΦs. The microarray data have been deposited in Gene Expression Omnibus (GEO) database (accession number GSE139554). (B) Quantitativereal-time PCR (qPCR) confirmation of the microarray data for the key genes. n=3, *p<0.05; **p<0.01; ***p<0.001; two-tailed Student’s t-test. (C) Western blot analysis of indicated proteins in BMDMs from WT, MΦ-TFEBtg or MΦ-TFEB-/- mice. The cells were treated with ECM for 24 hours. The number under a band indicates the relative intensity of the protein to β-actin (the relative intensity of the first band is set as 1). A representative blot is shown. (D) BMDMs from WT and TFEBtg MΦs were treated with DMEM or ECM for 24 hours; then the medium was replaced with fresh DMEM, and the conditioned medium was collected 16 hours later for analysis for IL-1β, IL-6 and prostaglandin E2 contents. n=5, *p<0.05; two-tailed Student’s t-test. Arg1, arginase 1; COX2, cyclo-oxygenase-2; cPLA2, cytosolic phospholipases A2; HIF-1α, hypoxia-inducible factor 1α; IL, interleukin; NLRP3, NLR Family Pyrin Domain Containing 3; PPARγ, peroxisome proliferator-activated receptor γ; TNFα, necrosis tumor factor α.

