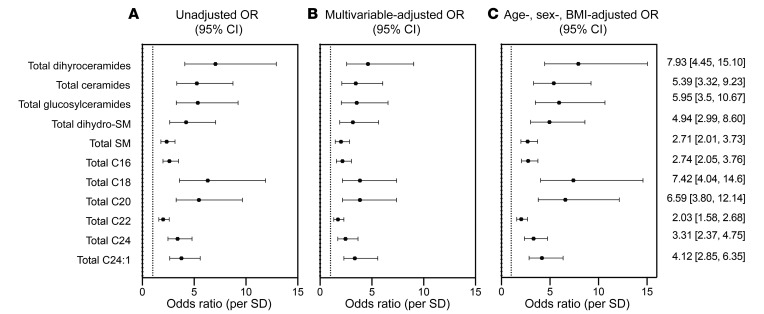
Figure 5. OR (95% CI) of CAD per SD of summed sphingolipid variables in the Utah CAD study.
(A) Unadjusted OR. (B) Fully adjusted OR (age, sex, BMI, total-C, LDL-C, VLDL-C, TGs, hypertension, diabetes, smoking). (C) Minimally adjusted OR (age, sex, BMI). The numerically presented ORs (95% CI) represent the minimally adjusted age, sex, and BMI model. Total SM, total sphingomyelin; Total C16, sum of all C16 acyl chains; Total C18, sum of all C18 acyl chains; Total C20, sum of all C20 acyl chains; Total C22, sum of all C22 acyl chains; Total C24, sum of all C24 acyl chains; Total C24:1, sum of all C24:1 acyl chains.

