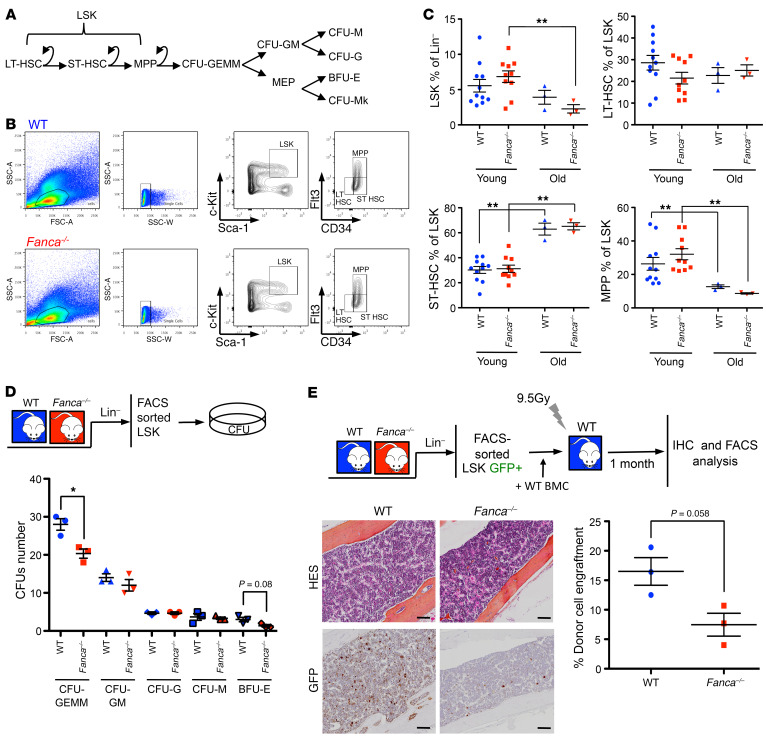
Figure 4. Fanca–/– mice display altered BM homeostasis.
(A) Schematic representation of the HSC hierarchy and colony stages. (B) Gating strategy for the analysis of the LSK fraction and its 3 subpopulations, long-term HSCs (LT-HSCs, Flt3–CD34–), short-term HSCs (ST-HSCs, Flt3–CD34+), and multipotent progenitors (MPPs, Flt3+CD34+). (C) Percentages of LSK cells, LT-HSCs, ST-HSCs, and MPPs calculated among the total numbers of Lin– cells in young (3 to 6 months old) and old (more than 1 year old) WT and Fanca–/– mice. Each point represents a single mouse. (D) WT and Fanca–/– CFUs of different colony types after LSK plating and 7 days of culture (n = 3). (E) Bottom left: representative images after immunohistochemical staining of GFP-positive cells in the BM sections of recipients. Bottom right: graph of donor chimerism in the circulating blood 4 weeks after LSK+ competitor transplants (n = 3). Scale bars: 50 μm. Statistical significance was assessed using an unpaired 2-tailed t test with Welch’s correction (C, D, and E). *P < 0.05; **P < 0.01.

