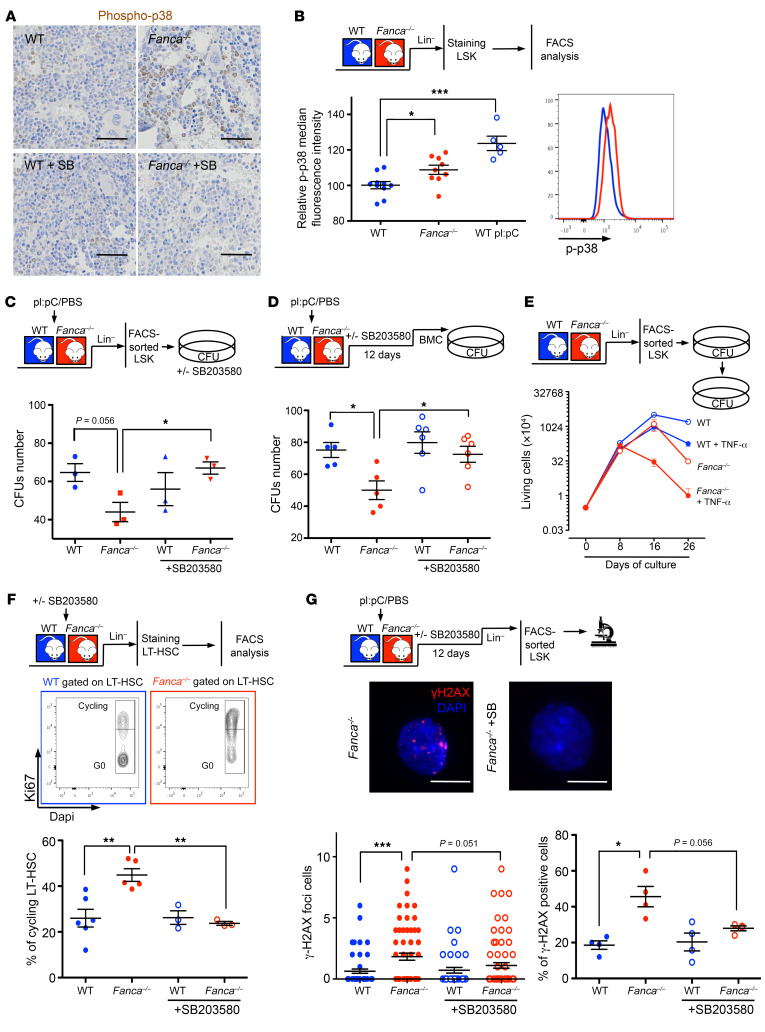
Figure 5. p38 Abnormalities in HSCs from Fanca–/– mice.
(A) Immunohistochemical staining of p-p38 in BM sections of WT and Fanca–/– mice treated or not with 50 mg/kg SB203580 i.p. daily for 12 days. Scale bars: 100 μm. (B) p-p38 Protein expression level measured by FACS (right) in LSK cells from untreated WT and Fanca–/– mice or from WT mice treated i.p. with pI:pC (5 mg/kg) 24 hours before. Each point represents a single mouse. (C) Colony-forming hematopoietic progenitor frequency counted 7 days after plating of LSK cells from WT and Fanca–/– mice (n = 3) treated 24 hours before with pI:pC (5 mg/kg). LSK cells were cultured with or without SB203580 (20 μM). (D) WT and Fanca–/– colony-forming hematopoietic progenitor frequency after a dose of pI:pC and in vivo treatment with SB203580 (50 mg/kg). Each point represents a single mouse. (E) Successive seeding of WT and Fanca–/– progenitors with or without TNF-α in MethoCult 3434 medium after replating at 3 × 10³ cells per dish in triplicate. Each point represents the mean value of 3 independent experiments started with 3 different mice. (F) Middle: Gating strategy to assess the percentage of cycling cells through the use of the Ki67+ intracellular marker. Bottom: percentages of cycling LT-HSCs from WT and Fanca–/– mice treated or not with a dose of SB203580 (50 mg/kg) for 24 hours. Each point represents a single mouse. (G) Bottom: Quantification of γ-H2ax foci per cell (left) or γ-H2ax-positive LSK cells (right) sorted from mice treated with a dose of pI:pC (5 mg/kg), followed or not by successive treatment with SB203580. Middle: representative image of Fanca–/– or Fanca–/– LSK cells treated with SB203580. Scale bars: 10 μm. Each point represents a single mouse. Statistical significance was assessed using an unpaired 2-tailed t test with Welch’s correction (C, D, F, and G) or 1-way ANOVA with Dunnett’s correction (B). *P < 0.05; **P < 0.01; ***P < 0.001.

