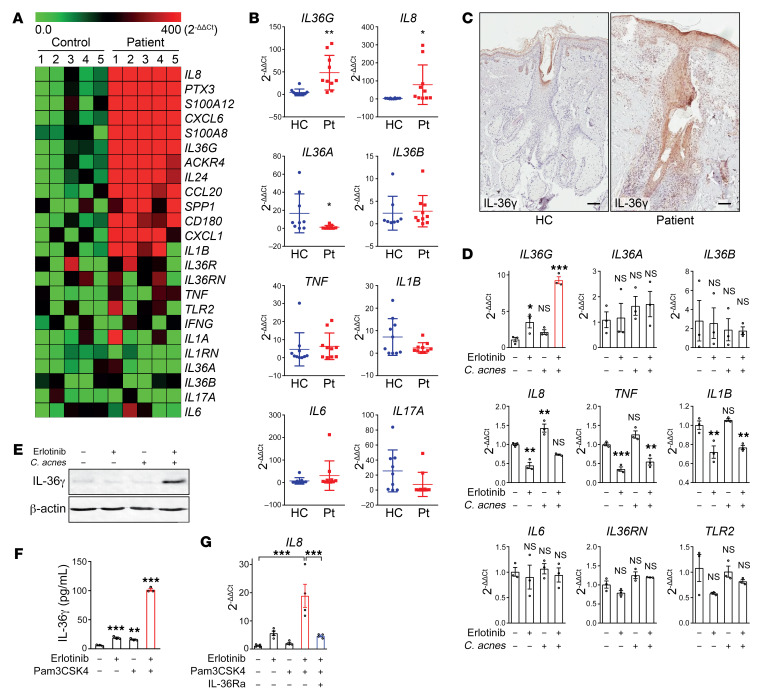
Figure 1. Increased production of IL-36γ in primary keratinocytes and lesional skin of patients suffering from acneiform eruptions in response to EGFR inhibition and C. acnes.
(A) Gene expression profiling from lesional skin of 5 patients and 5 healthy controls (HC). Heatmap of the top 12 most differentially expressed genes ranked from lowest false discovery rate (FDR) and 12 selected genes are shown. (B) Quantitative PCR (qPCR) of mRNA from lesional skin samples of 10 EGFR inhibitor–treated patients with acneiform eruption and 10 healthy control skin biopsies. Data represent mean ± SD. (C) Immunohistochemical staining with goat anti–IL-36γ antibody of formalin-fixed, paraffin-embedded skin sections of acneiform eruption patient and normal donors. Scale bars: 100 μm. Pictures are representative of 5 patients and 5 healthy individuals. (D) PHKs were exposed to erlotinib (EGFR inhibitor, 1 μM) and C. acnes (MOI of 10) for 6 hours. Total RNA was analyzed by qPCR. Data represent mean ± SEM (n = 3). (E) PHKs were exposed to erlotinib (1 μM) or C. acnes (MOI of 10) or both for 24 hours. Cell lysates were analyzed by Western blotting using specific antibodies against IL-36γ and β-actin. Blots were run contemporaneously with the same protein samples. (F) PHKs were exposed to erlotinib (1 μM) and Pam3CSK4 (5 μg/mL). IL-36γ secretion was measured by ELISA in culture supernatants. Data represent mean ± SEM (n = 3). (G) Ex vivo skin explants were exposed to erlotinib (1 μM), Pam3CSK4 (5 μg/mL), and/or human IL-36Ra (1 μg/mL). The skin samples were then analyzed by qPCR. Data represent mean ± SEM (n = 4). Data were analyzed with 2-tailed unpaired t test (B), and 1-way ANOVA followed by Dunnett’s (D and F) or Tukey’s multiple-comparisons test (G). *P < 0.05; **P < 0.01; ***P < 0.001. Data are representative of 3 independent experiments.

