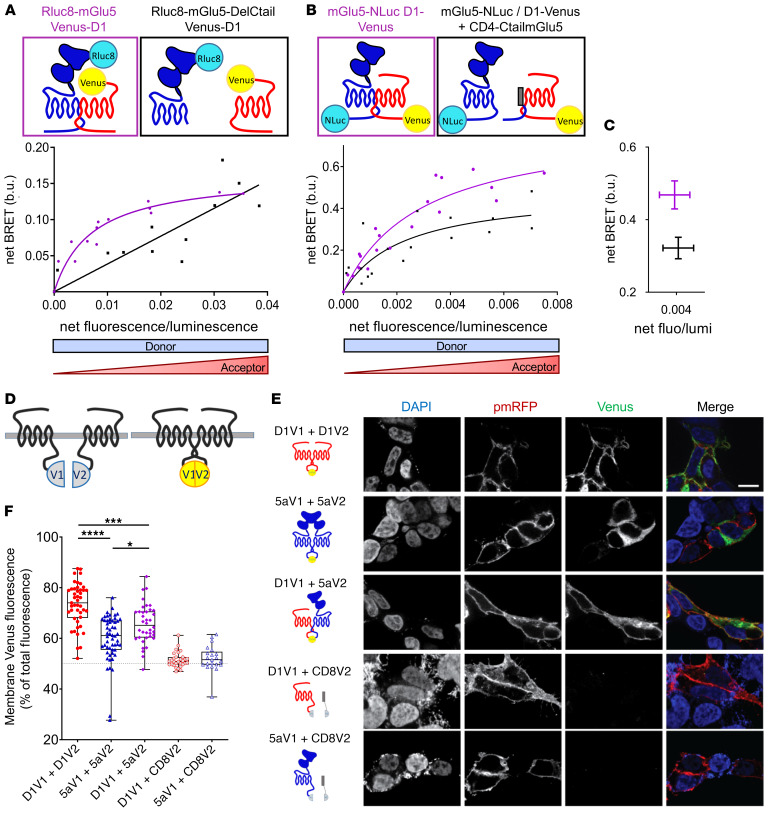
Figure 1. Heteromerization between mGlu5 and D1 receptors in living cells.
(A–C) BRET titration curves measured on HEK293 cells cotransfected with N- (A) or C-tagged (B) receptors. BRET signals were measured for increasing expression levels of acceptor (Venus-D1, A; or D1-Venus, B) at constant levels of donor expression (Rluc8-mGlu5, A; or mGlu5-Nluc, B). Results were analyzed by nonlinear regression on a pooled data set from 3 independent experiments, assuming a model with 1-site binding (GraphPad Prism 7). (A) BRET signals measured between Venus-D1 receptor and Rluc8-mGlu5 (purple curve) or Rluc8-mGlu5 deleted from its C-tail (Rluc8-mGlu5-DelCtail, black curve); b.u., BRET unit. (B) BRET signals measured between D1-Venus and mGlu5-Nluc, with (black curve) or without (purple curve) coexpression of mGlu5-Ctail fused to the CD4 membrane domain (CD4-CtailmGlu5). (C) Decrease of net BRET signal between D1-Venus and mGlu5-Nluc in cells coexpressing CD4-CtailmGlu5 (black) for identical D1-Venus/mGlu5-Nluc expression ratios. P = 0.0571, Mann-Whitney U test. (D–F) BiFC measured on transiently transfected HEK293 cells. (D) Schematic representation of BiFC principle. Nonfluorescent fragments from the Venus fluorescent protein (V1 and V2) are fused to putative interaction partners. Physical association triggers bimolecular fluorescent Venus complex. (E) BiFC images of receptors fused to nonfluorescent monomeric Venus split V1 or V2. Specificity was controlled in cells expressing D1-V1 or 5a-V1 together with CD8-V2 (last 2 rows). The green channel illustrates the expression of Venus complementation (V1 + V2), whereas DAPI and pmRFP fluorescences stain the nucleus and plasma membrane, respectively. Scale bar: 10 μm. (F) Quantification of complemented Venus fluorescence intensity at the membrane (colocalized with pmRFP) expressed as a percentage of whole-cell Venus fluorescence. Box and whiskers plots of 21 to 54 measurements. *P < 0.05; ***P < 0.001; ****P < 0.0001, Kruskal-Wallis test. Box and whiskers plots: in this and the following figures: line, median; bounds: 25th to 75th percentiles; whiskers, minimum to maximum.

