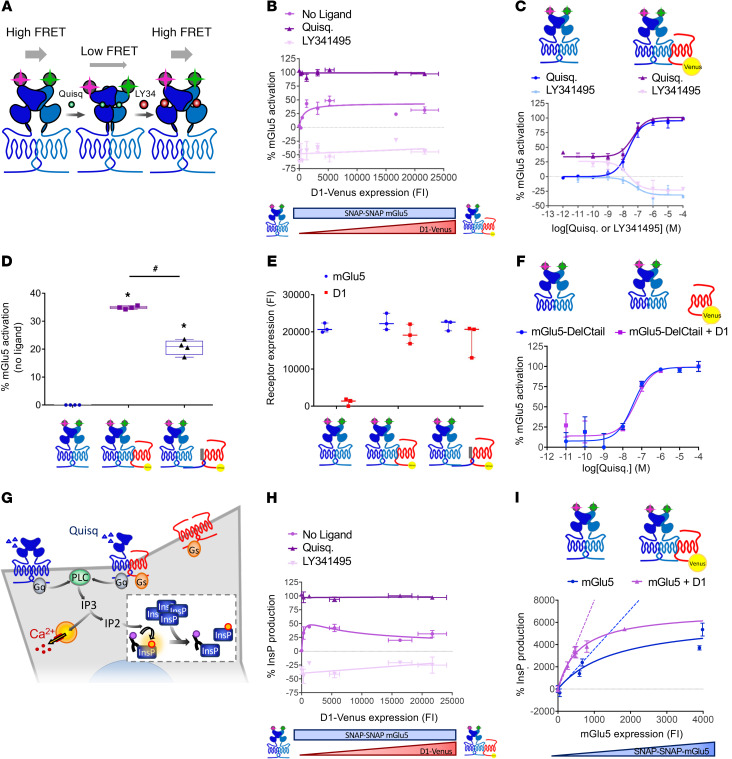
Figure 3. D1-mGlu5 heteromer favors Ca2+ signaling in vitro by enhancing basal activation and basal signaling of mGlu5 receptor.
A TR-FRET–based sensor monitors mGlu5 receptor ECD conformation. (A) In the absence of ligand or in the presence of antagonist (LY341495), the proximity of TR-FRET donor and acceptor results in a high FRET signal. Agonist-induced (quisqualic acid [Quisq]) relative movement of the ECDs decreases the FRET signal (23). (B and C) Percentage of mGlu5 active conformation (B) with increasing amount of D1-Venus receptors in basal conditions (no ligand), with Quisq (10 μM) or with LY341495 (100 μM) (C) in the absence (blue) or presence (purple) of D1 receptor (corresponding to 279 ± 68 D1 fluorescence intensity [FI] on B) with increasing concentrations of Quisq (dark color) or LY341495 (light color). (D) mGlu5 basal activation when expressed alone (left), with D1 receptor (middle), or with D1 receptor and mGlu5Ctail as dominant negative peptide (right). *P < 0.05 vs. mGlu5 basal activation; #P < 0.05 vs. mGlu5 plus D1 receptor activation, unpaired t test (Mann-Whitney U test). Box and whiskers plots. (E) SNAP-mGlu5 and D1-Venus receptor expression levels were controlled by measurement of SNAP-Lumi4-Tb and Venus, respectively (FI). (F) Percentage of mGlu5-DelCtail active-conformation measured in absence (blue) or presence (purple) of D1 receptor with increasing concentrations of Quisq. (G) PLC activation is reported by new InsP production-induced decrease of HTRF signal between fluorescent-InsP and InsP-antibody (insert). (H) mGlu5-induced InsP production with increasing amount of D1 receptors in basal conditions (no ligand), with Quisq (10 μM), or with LY341495 (100 μM). InsP production was normalized to the maximal activity of mGlu5 in the presence of agonist. (I) Constitutive InsP production with increasing amount of mGlu5 receptor in absence (blue) or presence (purple) of a constant amount of D1 receptor (corresponding to 319 ± 4 D1 FI on H). Values are shown as mean ± SEM of 3 independent experiments.

