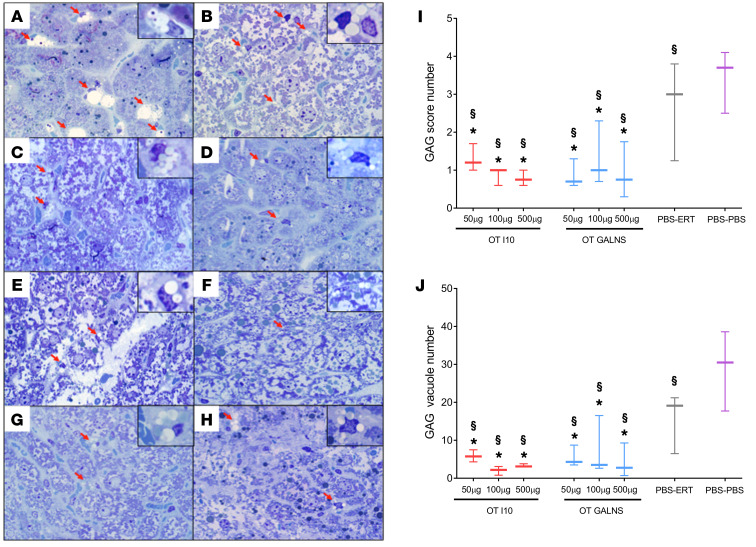
Figure 6. Glycosaminoglycan (GAG) accumulation in liver.
Light microscopic findings of toluidine blue–stained, 1-μm-thick sections of mouse liver from (A) PBS control group, (B) ERT nontolerized group, and groups tolerized with peptide I10 (C, 50 μg; D, 100 μg; and E, 500 μg) or GALNS (F, 50 μg; G, 100 μg; and H, 500 μg) prior to ERT. The red arrows and insets show GAG aggregates. Accumulation of GAGs was significantly higher in control groups (A and B) and much less in treated groups (D and H). Wild-type mouse cells do not have any GAG accumulation because they have a functional GALNS enzyme. Original magnification, ×100 and ×400 (insets). The number of cells with cytoplasmic vacuoles (I) as well as total number of vacuoles (J) were counted in 8 random microscopic high-power fields (×100). A score from 0 to 5 (0 = none, 1 = 1, 2 = 2–3, 3 = 4–5, 4 = 6–7, and 5 = 7) was assigned according to the number of cells containing vacuoles per high-power field. Quantitative data are represented as a box-and-whisker plot, with bounds from 25th to 75th percentile, median line, and whiskers ranging from 5th and 95th percentile values. *P < 0.05, Benjamini and Hochberg adjusted, for differences between tolerized and nontolerized (PBS-ERT) mice. §P < 0.05, Benjamini and Hochberg adjusted, for differences between ERT-treated mice and untreated (PBS-PBS) mice.

