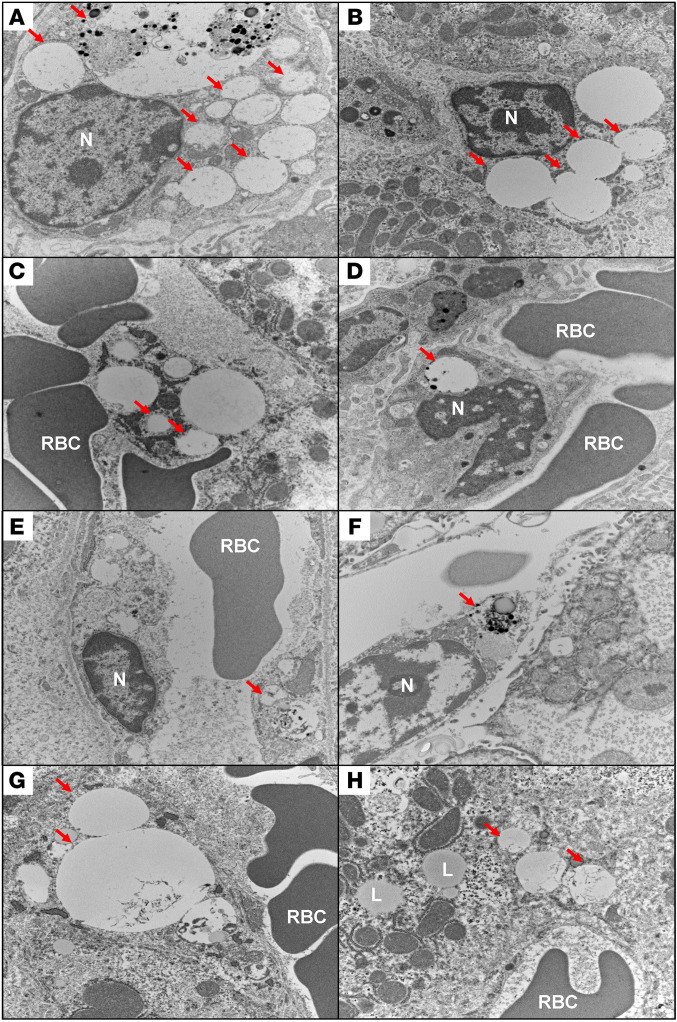
Figure 7. Ultrastructural demonstration of glycosaminoglycan (GAG) accumulation in liver.
Electron microscopic findings of mouse liver from (A) PBS control group, (B) ERT nontolerized group, and groups tolerized with peptide I10 (C, 50 μg; D, 100 μg; and E, 500 μg) or GALNS (F, 50 μg; G, 100 μg; and H, 500 μg). The red arrows show GAG aggregates and distended lysosomal vacuoles. Accumulation of GAGs was significantly higher in control groups (A and B) and much less in treated groups (D and H). Original magnification, ×15,000. RBC, red blood cells; N, nucleus; L, lipid vacuole.

