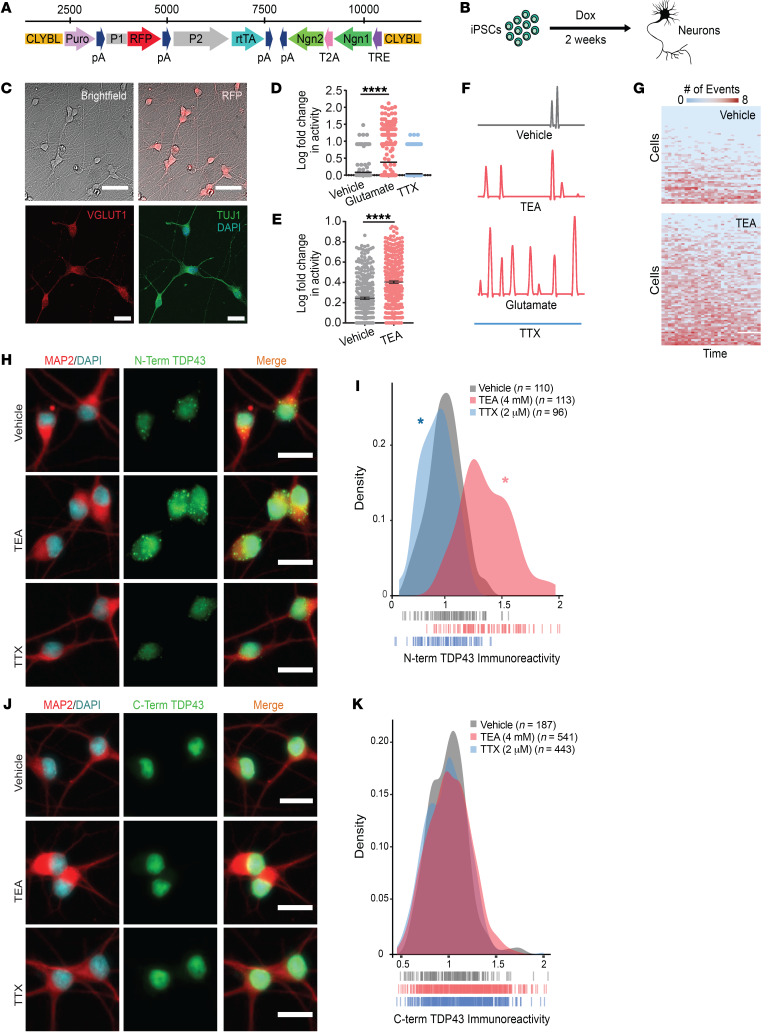
Figure 1. Hyperexcitability drives TDP43 accumulation in human iNeurons.
(A) Schematic of the cassette used to integrate Ngn1 and Ngn2 into the CLYBL safe harbor locus under a doxycycline-inducible (Tet-on) promoter. CLYBL, targeting sequence; Puro, puromycin resistance gene; pA, poly-A tail; P1, P2, promoters; RFP, mCherry; rtTA, reverse tetracycline-controlled transactivator; Ngn1 and -2, neurogenin 1 and 2; T2A, self-cleaving peptide; TRE, tetracycline response element. (B) Timeline depicting the differentiation of iPSCs into forebrain-like neurons within 2 weeks of doxycycline addition. (C) The resultant neurons are RFP positive and express the neuronal markers VGLUT1 and TUJ1. (D) Spontaneous neuronal activity visualized by the Ca2+ reporter gCaMP6f at 2 weeks. Activity was pharmacologically modulated with bath application of glutamate or TTX. Vehicle n = 257, glutamate n = 327, TTX n = 403, stratified among 3 replicates. ****P < 0.0001 by 1-way ANOVA with Dunnett’s post hoc test. (E) Treatment with TEA significantly increased neuronal activity. Vehicle n = 312, TEA n = 369, stratified among 3 replicates. ****P < 0.0001 by 2-tailed t test. (F) Example traces depicting changes in gCaMP6f fluorescence for each condition. (G) Heatmaps depicting global changes in activity. Each row represents 1 neuron, and each column represents a 20-second observation window. Thirty intervals were collected over a 12-hour period. Box color indicates the relative firing rate of each cell at each time point, ranging from low (blue) to high (red). (H) N-terminal TDP43 immunoreactivity was increased in TEA-treated iNeurons and decreased in TTX-treated iNeurons. (I) Density plot depicting the change in TDP43 immunoreactivity between conditions. Vehicle n = 110, TEA n = 113, TTX n = 96, 2 replicates; vertical lines indicate single neurons. *P < 0.05 by Kolmogorov-Smirnov test. (J) No change in TDP43 abundance was detected using an antibody directed against the C-terminus. (K) Density plot depicting the change in C-terminal TDP43 immunoreactivity between conditions. Vehicle n = 187, TEA n = 541, TTX n = 443, 2 replicates; vertical lines indicate single neurons. No significant differences as determined by the Kolmogorov-Smirnov test. Scale bars: 50 μm (top), 20 μm (bottom) (C); 20 μm (H and J).

