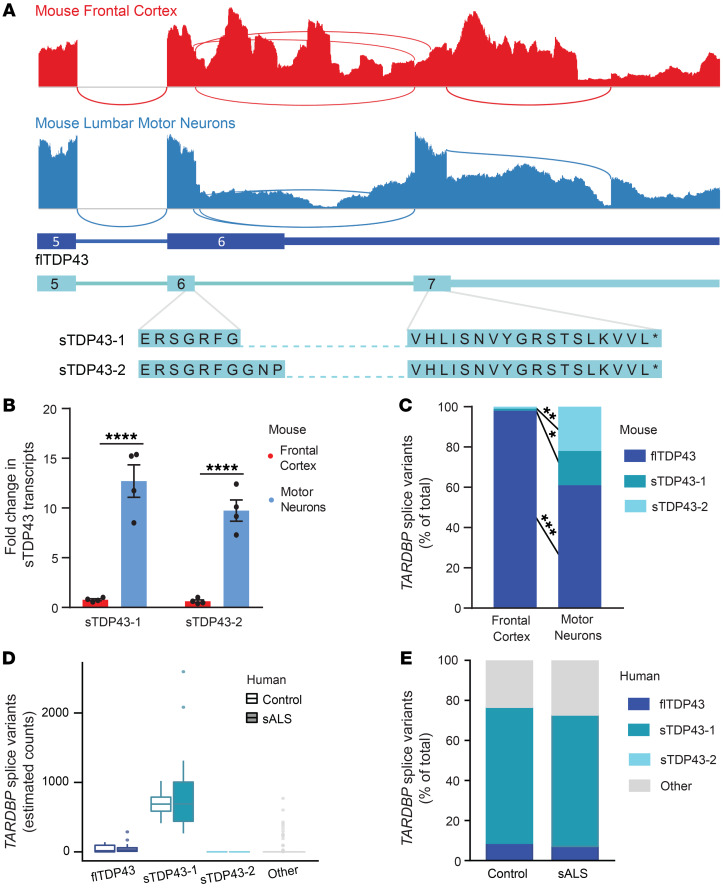
Figure 7. sTDP43 transcripts are enriched in lumbar motor neurons.
(A) Sashimi plots depicting TARDBP splicing in murine frontal cortex homogenate (red) or microdissected lumbar motor neurons (blue). Numbers correspond to exons, and asterisks represent stop codons. (B) Both sTDP43-1 and sTDP43-2 splice events are highly enriched in lumbar motor neurons compared with frontal cortex homogenate. Graph depicts read counts normalized to reads per million for each library. Analysis includes 4 replicates. ****P < 0.0001 by multiple t test with the Holm-Sidak correction. (C) While sTDP43-1 and -2 each comprise approximately 1% of the total TARDBP transcripts in frontal cortex homogenate, they make up 17% and 22% of total TARDBP transcripts in lumbar motor neurons, respectively. Frontal cortex n = 6, lumbar motor neurons n = 4. *P < 0.05, **P < 0.01, ***P < 0.001 by 2-way ANOVA with Sidak’s multiple-comparisons test. (D) sTDP43-1 is enriched within lumbar motor neurons microdissected from both control (n = 9) and sALS (n = 13) patient tissue. (E) sTDP43-1 makes up the majority of total TARDBP transcripts in both control and sALS patient lumbar motor neurons.

