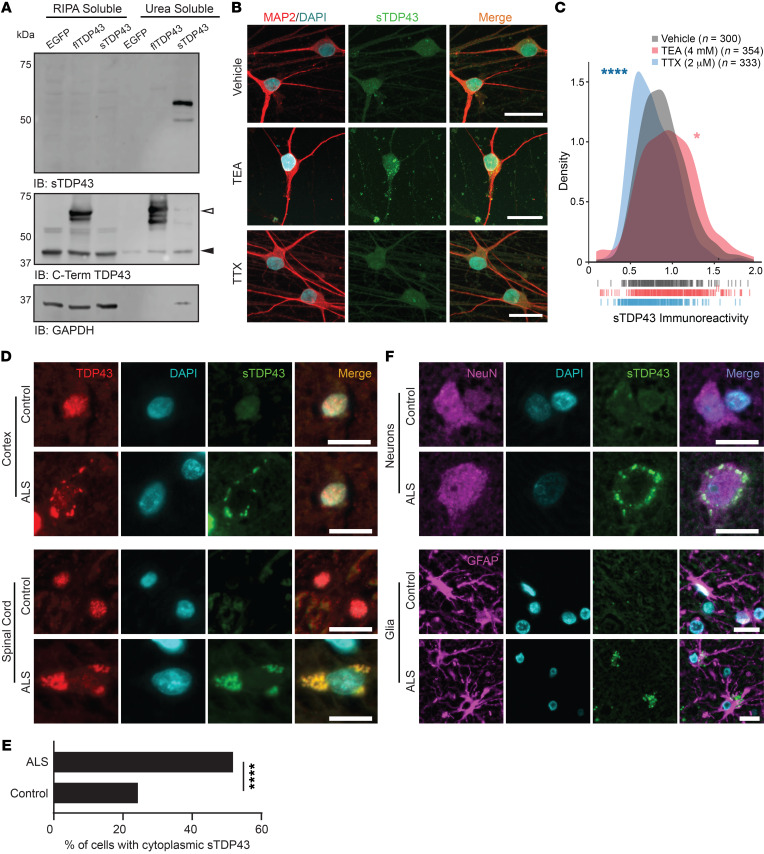
Figure 8. Endogenous sTDP43 is detectable in vivo by antibodies generated against its distinct C-terminus.
(A) Western blot of EGFP-tagged flTDP43 or sTDP43 overexpressed in HEK293T cells. Black arrowhead, endogenous TDP43; white arrowhead, EGFP-flTDP43. (B) ICC using sTDP43 antibodies showed increased immunoreactivity in TEA-treated iNeurons and decreased immunoreactivity in TTX-treated iNeurons. (C) Density plot depicting the change in sTDP43 immunoreactivity between conditions. Vehicle n = 300, TEA n = 354, TTX n = 333, 3 replicates; vertical lines indicate single neurons. *P < 0.05, ****P < 0.0001 by Kolmogorov-Smirnov test. (D) IHC comparing the distribution of N-terminal TDP43 and sTDP43 in spinal cord and cortex from patients with sporadic ALS and controls. (E) Quantification of cells with cytoplasmic sTDP43 in control and ALS patient spinal cord (control n = 115, ALS n = 110; data representative of 2 control and 3 ALS patients). ****P < 0.0001 by Fisher’s exact test. (F) IHC demonstrating neuronal and glial sTDP43 accumulation in cortex from individuals with sALS and controls. Scale bars: 20 μm (B, D, and F).

