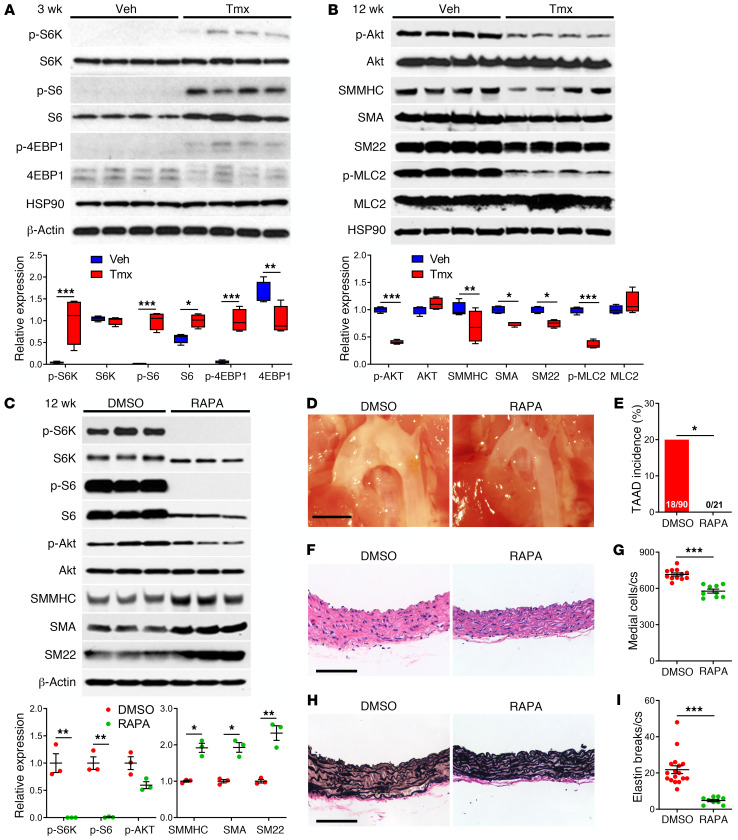
Figure 3. mTOR activation and inhibition in Tsc1-deficient aortas.
Tsc1fl/fl Myh11-CreERT2 mT/mG mice were treated with tamoxifen (Tmx) or vehicle (Veh) at 1.5 weeks of age and their thoracic aortas were analyzed at various times. (A) Western blots for indicated proteins at 3 weeks with densitometry of protein bands relative to loading controls (n = 4). (B) Similar analyses at 12 weeks (n = 4). Alternatively, tamoxifen-induced mice were treated with 1% DMSO or rapamycin (RAPA) at 2 mg/kg/d i.p. from 2 to 12 weeks and their thoracic aortas were analyzed. (C) Western blots for indicated proteins at 12 weeks with densitometry of phospho-proteins relative to total proteins and contractile proteins to loading controls (n = 3). (D) In situ examination (scale bar: 2 mm) and (E) TAAD incidence. (F) H&E stains of ascending aortas (scale bar: 100 μm) and (G) number of medial cells per cross section (cs). (H) Verhoeff–Van Gieson stains of ascending aortas (scale bar: 100 μm) and (I) number of elastin breaks per cross section (n = 9–17 per group, DMSO results pooled with similar results of untreated Cre-induced mice for greater statistical power). Data are represented as individual values with mean ± SEM bars or as box-and-whisker plots with interquartile range, median, minimum, and maximum. *P < 0.05; **P < 0.01; ***P < 0.001 for Tmx vs. Veh or RAPA vs. DMSO by 2‑way ANOVA (A–C), Fisher’s exact test (E), or t test (G and I).

