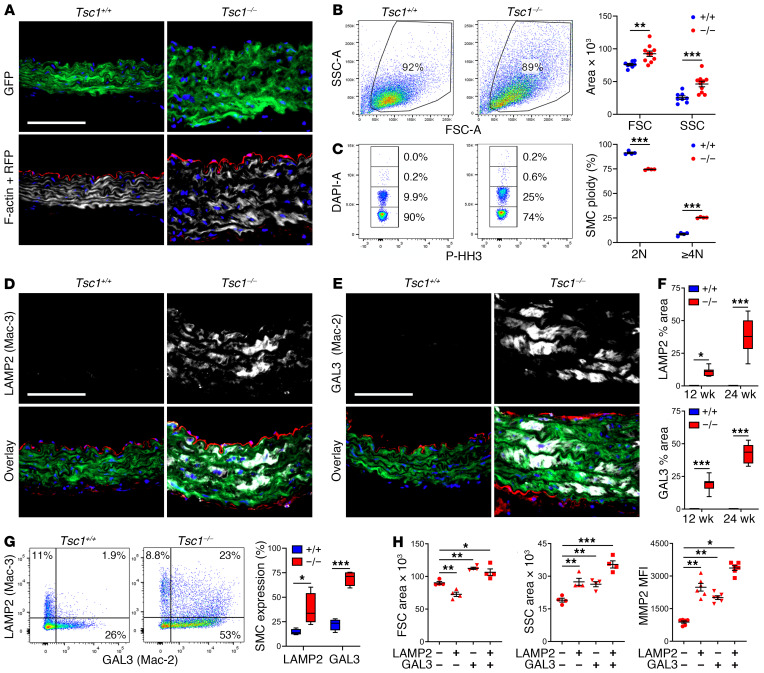
Figure 5. Morphologically abnormal SMCs acquire limited macrophage markers.
Myh11-CreERT2 mT/mG (Tsc1+/+) and Tsc1fl/fl Myh11-CreERT2 mT/mG (Tsc1−/−) mice were treated with tamoxifen at 1.5 weeks and the thoracic aortas were analyzed at 24 weeks. (A) Immunofluorescence microscopy of ascending aortas identified SMCs by GFP expression (green), nuclei by DAPI labeling (blue), cells other than SMCs by RFP expression (red), and F-actin filaments by phalloidin binding (white). Scale bar: 100 μm. (B) Flow cytometry of enzymatically dispersed GFP+ SMCs determined forward scatter (FSC, indicator of cell size) and side scatter (SSC, indicator of cell granularity) (n = 8–10) and (C) fraction of diploid (2N) and polyploid (≥4N) nuclei by DAPI labeling in nonproliferating, phospho-histone H3–negative (p-HH3–negative) single cells (n = 5). (D) Immunostaining for LAMP2 (also known as Mac-3) and (E) GAL3 (also known as Mac-2) (white) with GFP, RFP, and DAPI overlay in ascending aortas (scale bars: 100 μm) and (F) quantified as percentage area (n = 8). (G) Flow cytometry for intracellular expression of LAMP2 (Mac-3) and GAL3 (Mac-2) by GFP+ SMCs (n = 4) and (H) forward, side scatter area, and MMP2 expression by subpopulations of LAMP2/GAL3–expressing cells (n = 4–6). Data are represented as individual values with mean ± SEM bars or as box-and-whisker plots with interquartile range, median, minimum, and maximum. *P < 0.05; **P < 0.01; ***P < 0.001 by 2-way ANOVA (B, C, F, and G) or 1-way ANOVA (H).

