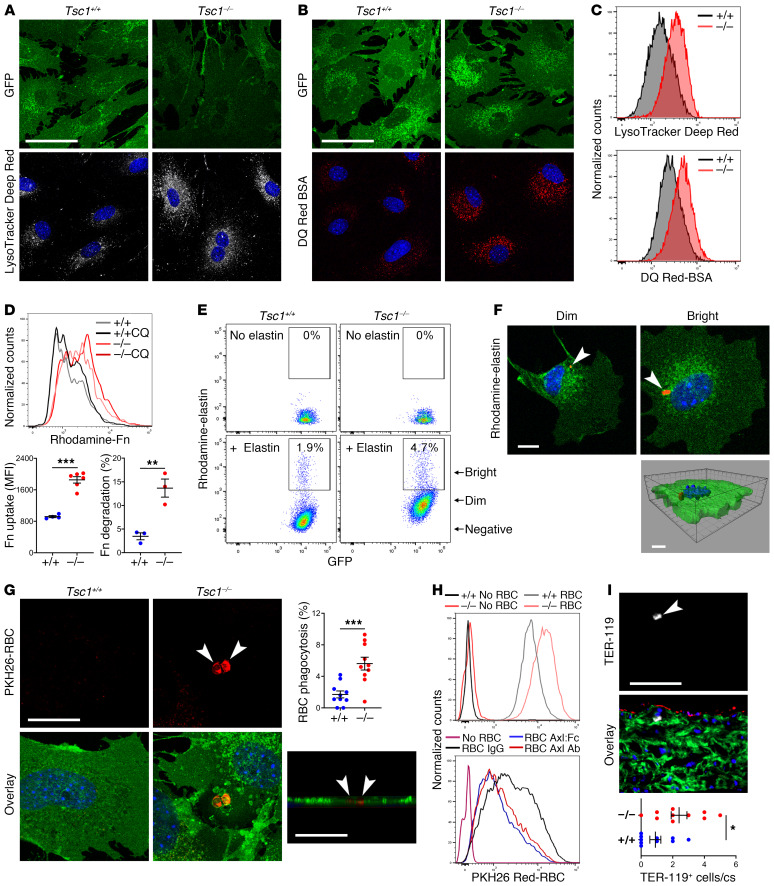
Figure 8. SMCs gain degradative functions.
SMCs were cultured from thoracic aortas of 24-week-old, tamoxifen-treated Myh11-CreERT2 mT/mG (Tsc1+/+) and Tsc1fl/fl Myh11-CreERT2 mT/mG (Tsc1−/−) mice. Confocal microscopy of GFP+ SMCs (green) incubated with (A) LysoTracker Deep Red (white) that accumulates in perinuclear vesicles or (B) DQ Red–conjugated BSA (red) that is visualized after hydrolysis of the probe. See supplemental methods for details. Scale bars: 50 μm. (C) Fluorescence intensity of the cells by flow cytometry. (D) Flow cytometry of GFP+ SMCs cultured with rhodamine-labeled fibronectin (Fn) with or without chloroquine (CQ) to distinguish endocytosis-dependent uptake (n = 4–6) from lysosomal degradation (n = 3). (E) Flow cytometry of GFP+ SMCs cultured with or without rhodamine-labeled elastin and (F) confocal microscopy of cells sorted for dim or bright rhodamine fluorescence revealing elastin fragments (red, arrows) confirmed as intracellular by Z‑stack image. Scale bar: 10 μm. (G) Confocal microscopy of GFP+ SMCs (green) cultured with PKH26-labeled, heat-damaged erythrocytes (red, arrows) confirmed as intracellular by Z-stack image (scale bars: 25 μm); percentage GFP+ SMCs containing erythrocytes (n = 10). (H) Flow cytometry of GFP+ SMCs cultured without or with erythrocytes in the presence of control IgG, Axl-neutralizing Ab, or Axl:Fc chimeric protein. (I) Immunofluorescence microscopy of ascending aorta for erythrocyte antigen, TER-119 (white, arrow) with GFP (green), RFP (red), and DAPI (blue) overlay (scale bar: 100 μm); number of medial TER-119+ cells per cross section (cs) (n = 10). Data are represented as individual values with mean ± SEM bars. *P < 0.05, **P < 0.01, ***P < 0.001 for Tsc1−/− vs. Tsc1+/+ by t test.

