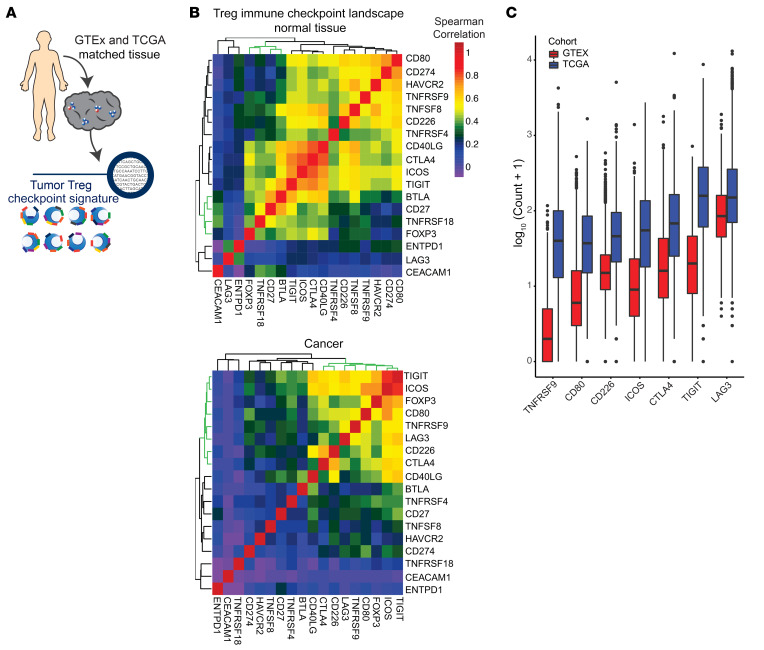
Figure 3. Conserved Treg checkpoint landscape present in bulk sequencing of multiple cancers.
(A) Treg immune checkpoint signatures were examined by analysis of data available through TCGA and RNA-Seq performed on purified Tregs. Normalized and batch effect controlled data from GTEx and TCGA was used to examine bulk tissue checkpoint signature across normal and cancer tissue. (B) Correlation matrix of immune checkpoints and FOXP3 expression in normal tissue or cancer. The green dendrogram represents FOXP3-associated checkpoints. (C) Box plots of log10-normalized expression of Treg-correlated immune checkpoints ordered by median expression in normal tissue and cancer. All immune checkpoints were significantly higher in TCGA versus GTEx samples (P < 2 × 10–16 for GTEx vs. TCGA for each checkpoint).

