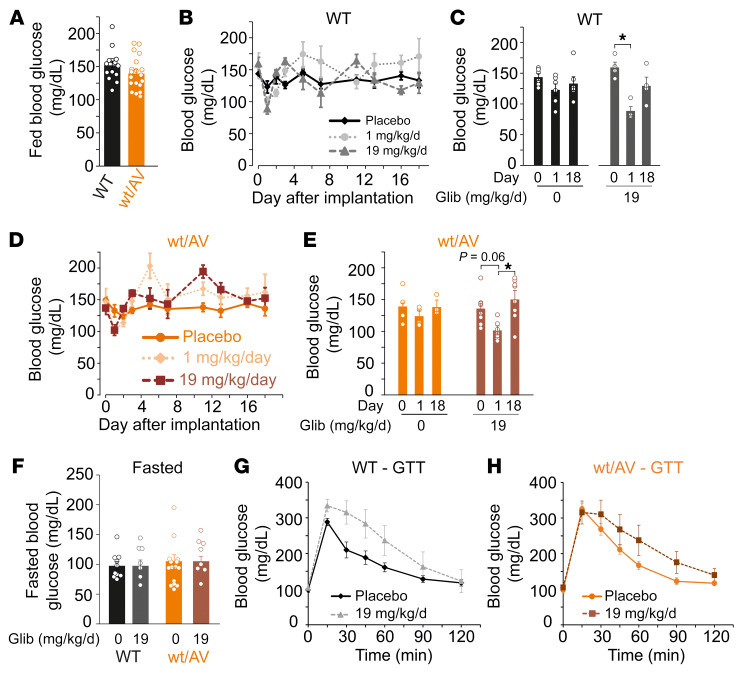
Figure 3. Chronic high-dose glibenclamide induces only transient hypoglycemia.
(A) Summary of blood glucose levels in fed WT and SUR2wt/AV mice on day 0 prior to pellet implantation. (B) Mean blood glucose measurements from WT mice implanted with placebo pellets (black diamonds, solid line; n = 6), approximately 1 mg/kg/day glibenclamide pellets (light gray circles, dotted line; n = 4), and approximately 19 mg/kg/day glibenclamide pellets (dark gray triangles, dashed line; n = 4). (C) Summary of blood glucose measurements for WT mice implanted with placebo pellets (black bars) or approximately 19 mg/kg/day glibenclamide pellets (gray bars) on day 0, 1, and 18. (D) Mean blood glucose measurements from SUR2wt/AV mice implanted with placebo pellets (dark orange circles, solid line; n = 4), approximately 1 mg/kg/day glibenclamide pellets (light orange diamonds, dotted line; n = 7), and approximately 19 mg/kg/day glibenclamide pellets (brown squares, dashed line; n = 8). (E) Summary of blood glucose measurements for SUR2wt/AV mice implanted with placebo pellets (orange bars) or approximately 19 mg/kg/day glibenclamide pellets (brown bars) on day 0, 1, and 18. (F) Fasted BG in mice which had been implanted with either placebo or high-dose glibenclamide more than 30 days prior. Glucose tolerance test data for WT (G) and SUR2wt/AV (H) mice implanted with placebo or approximately 19 mg/kg/day glibenclamide pellets. For summary figures, individual data points are represented as open circles, bars show mean ± SEM. Statistical significance was determined by 1-way ANOVA and subsequent post hoc Tukey’s test for pairwise comparison. *P < 0.05 from pairwise post hoc Tukey’s test.

