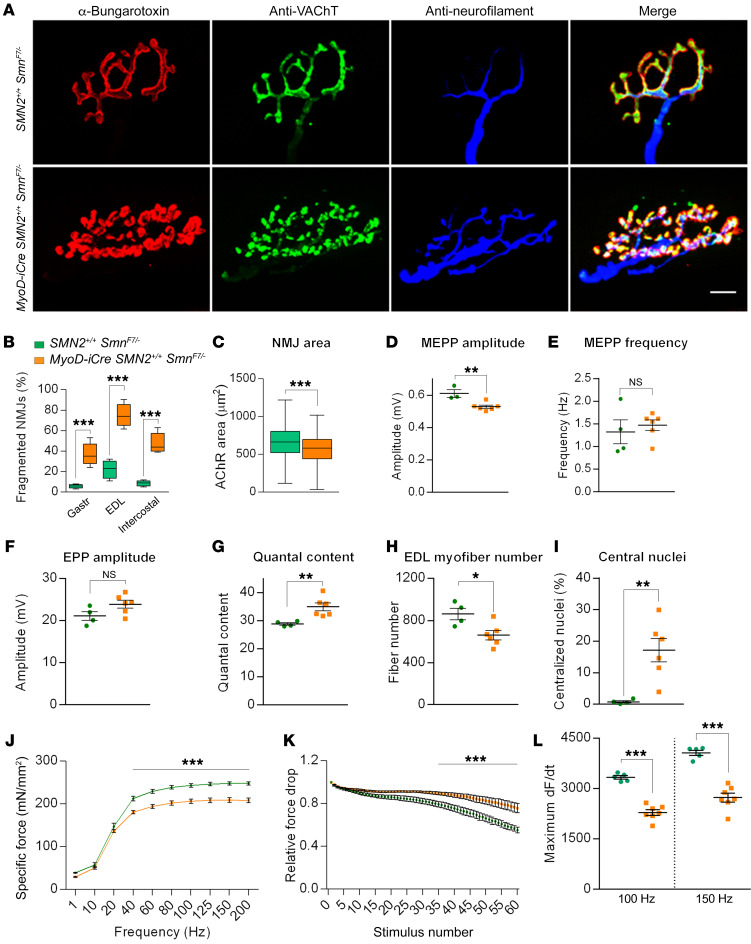
Figure 7. NMJ pathology and neuromuscular dysfunction in MyoD-iCre SmnF7/– mutants bearing 2 SMN2 copies.
(A) NMJs from the EDL muscles of 7-month-old mice show profound fragmentation of endplates in mutants. Scale bar: 10 μm. (B) Quantified representation of fragmented NMJs in 7-month-old mutant and control mice; t test, n ≥ 500 endplates from n ≥ 3 mice of each genotype. (C) Graph depicts NMJ size in gastrocnemius muscles of 7-month-old mutants and controls; t test, n ≥ 420 endplates from n = 3 mice of each genotype. Quantified depictions of (D) MEPP amplitude, (E) MEPP frequency, (F) EPP amplitude, and (G) quantal content in EDL muscles of 7-month-old mutant and control mice. NS: P > 0.05, t test, n ≥ 10 endplates per animal from n ≥ 4 mice of each genotype. Graphs represent (H) myofiber numbers and (I) the proportion of fibers with central nuclei in EDL muscles of analyzed mice; t test, n ≥ 4 mice of each genotype. Quantified depictions of (J) peak specific force, (K) relative force drop, and (L) rate of maximal force production in soleus muscles of 5- to 7-month-old mice; 2-way ANOVA for results in J and t tests for results in K and L, n ≥ 5 mice of each cohort. *P < 0.05; **P < 0.01; ***P < 0.001.

