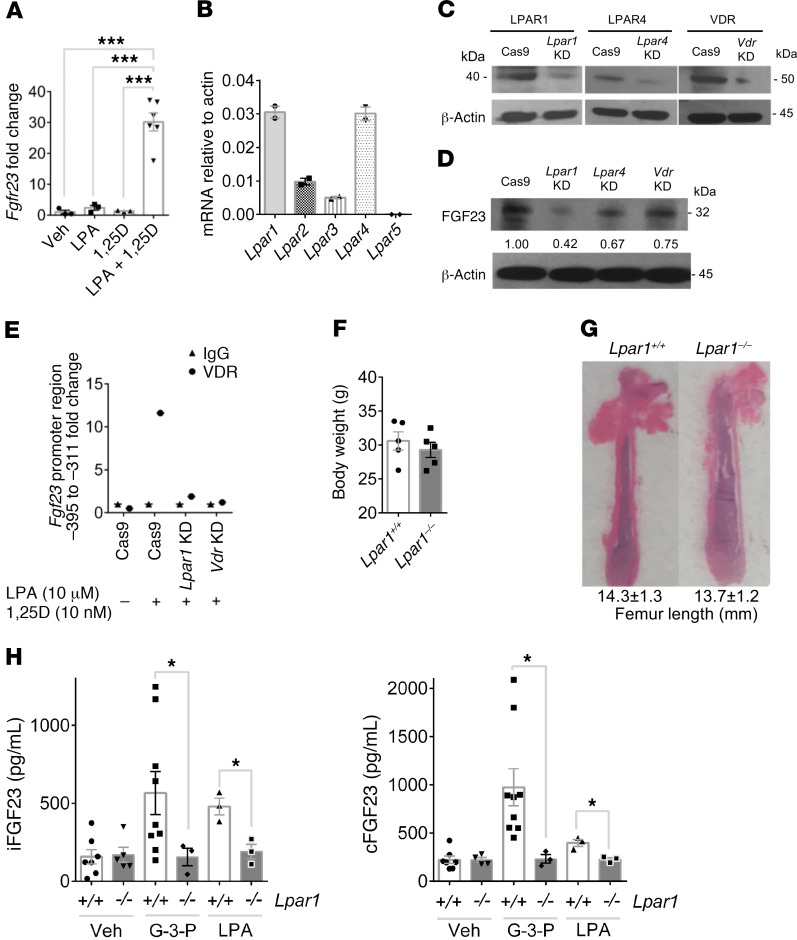
Figure 5. LPAR1 mediates the effect of G-3-P and LPA on FGF23 production.
(A) Fgf23 expression in Ocy454 cells treated with vehicle, 10 μM LPA, 10 nM 1,25(OH)2D (1,25D), or both (n = 3–6 per group). (B) Expression of LPA receptors in Ocy454 cells (n = 2). (C and D) Immunoblots of primary osteoblasts following stable deletion of Lpar1, Lpar4, or Vdr, probing for targeted gene products (C) or FGF23 following treatment with LPA (10 μM) and 1,25(OH)2D (10 nM) (D). Shown are representative gels from 1 of 2 independent experiments. (E) ChIP of the Fgf23 promoter following LPA 18:1 and 1,25(OH)2D treatment in WT or Lpar1- or Vdr-deficient cells. Plot shows relative enrichment of the putative VDR target site pulled down by an antibody against VDR compared with IgG. (F and G) Body weights (n = 5 mice per group) (F) and femur length (G) of Lpar1–/– mice and Lpar+/+ littermates. (H) Plasma iFGF23 and cFGF23 levels after i.p. injection of G-3-P (300 mg/kg), LPA 18:1 (50 mg/kg), or vehicle for Lpar1–/– mice and Lpar1+/+ littermates (n = 3–9 per group). Data represent the mean ± SEM. *P < 0.05 and ***P < 0.0001, by 1-way ANOVA followed by Tukey’s multiple comparisons test (A) or 2-sided Student’s t test (F and H).

