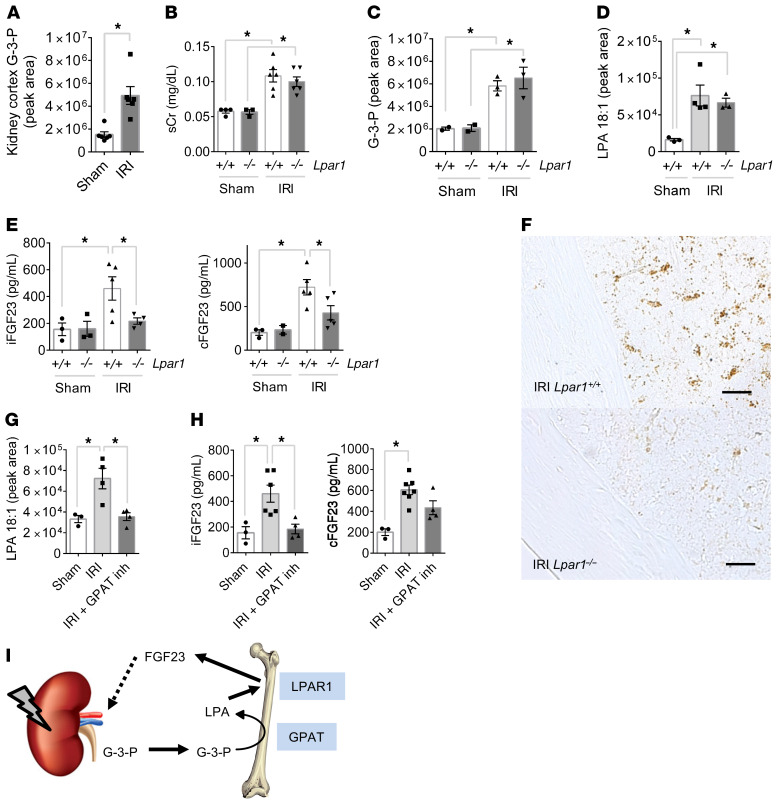
Figure 6. AKI increases FGF23 production through G-3-P and LPA signaling.
(A) Kidney G-3-P levels 10 minutes after IRI or sham surgery (n = 6 per group). (B–E) Serum creatinine (sCr) (B), plasma G-3-P (C), bone marrow LPA (D), and plasma iFGF23 and cFGF23 (E) levels in Lpar1–/– mice and Lpar1+/+ littermates subjected to IRI. All measurements were made after 24 hours, except for G-3-P levels (4 hours). n = 2–6 per group. (F) Immunohistochemistry for FGF23 in femurs from Lpar1–/– mice and Lpar1+/+ littermates subjected to IRI. Shown are representative images from 1 of 2 independent experiments. Scale bars: 100 μm. (G and H) Bone marrow LPA (G) and plasma iFGF23 and cFGF23 (H) levels in C57Bl/6J mice subjected to IRI with or without FSG67 (0.25 mg/kg). n = 4 per group. Data represent the mean ± SEM. *P < 0.05, by 2-sided Student’s t test (A), 2-way ANOVA followed by Tukey’s multiple comparisons test (B, C, and E), or 1-way ANOVA followed by Tukey’s multiple comparisons test (D, G, and H). (I) Schema depicting the action of kidney-derived G-3-P on bone FGF23 production, whereby local GPAT mediates conversion of G-3-P to LPA, which subsequently signals through LPAR1 to stimulate FGF23 expression.

