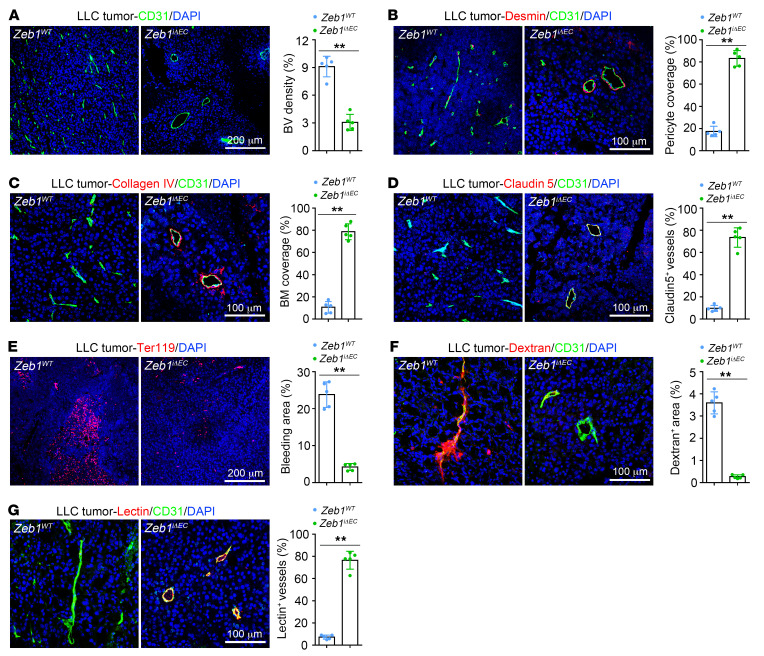
Figure 5. Endothelial ZEB1 inactivation reduces LLC tumor angiogenesis while eliciting vessel normalization.
(A) Immunofluorescent images (left) and comparison (right) of CD31+ blood vessel (BV) density in LLC tumors grown for 21 days in Zeb1WT versus Zeb1iΔEC mice (5 mice each). Nuclei, DAPI (blue). (B–D) Immunofluorescent images (left) and comparisons (right) of desmin+ pericyte coverage along BVs (B), collagen type IV+ basement membrane (BM) coverage alongside BVs (C), and claudin 5 distribution on BVs (D) in LLC tumors of Zeb1WT versus Zeb1iΔEC mice (5 mice each). (E) Immunofluorescence images (left) and comparison (right) of extravasated Ter119+ red blood cells in LLC tumors of Zeb1WT versus Zeb1iΔEC mice (5 mice each). The Ter119+ bleeding area is presented as a percentage of total sectional area. (F and G) Immunofluorescent images (left) and comparisons (right) of dextran leakage (F) and lectin perfusion (G) of BVs in LLC tumors of Zeb1WT versus Zeb1iΔEC mice (5 mice each). Dextran and lectin were intravenously injected 30 minutes before euthanization. The dextran+ area or lectin+ vessels are presented as a percentage of total sectional area or CD31+ area, respectively. All data are represented as mean ± SD. **P < 0.01. Differences were tested using unpaired 2-sided Student’s t test.

