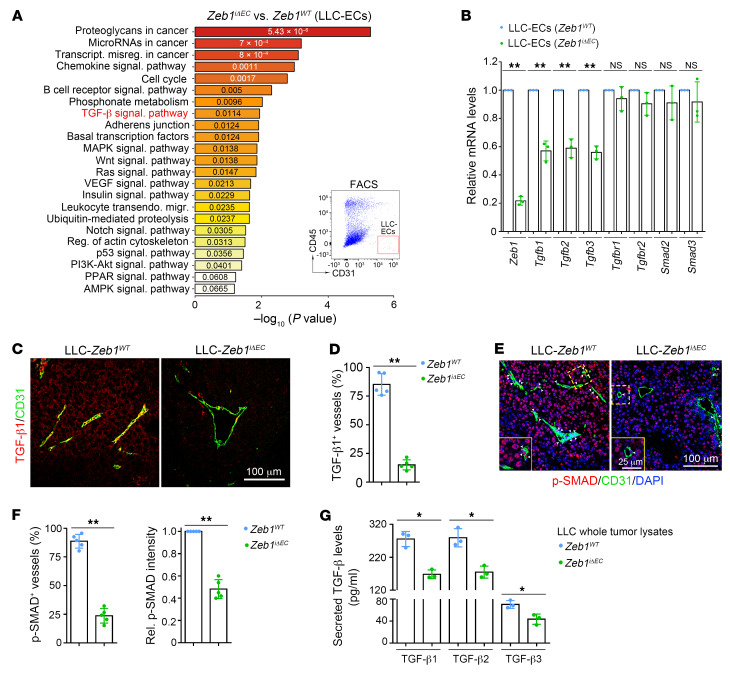
Figure 9. Vascular ZEB1 inactivation represses TGF-β expression and secretion in the LLC tumor.
(A) GO analysis of signature genes that are differentially expressed in FACS-isolated ECs dissected from LLC tumors of Zeb1WT and Zeb1iΔEC mice, revealing significantly modulated functional pathways. (B) qRT-PCR analyses of indicated gene expression in FACS-isolated ECs dissected from LLC tumors of Zeb1WT and Zeb1iΔEC mice (n = 3 independent experiments). (C and D) Immunofluorescent images (C) and comparison (D) of TGF-β1+ BVs in LLC tumors of Zeb1WT versus Zeb1iΔEC mice (5 mice each). (E and F) Immunofluorescent images (E) and comparison (F) of p-SMAD2/3+ BVs in LLC tumors of Zeb1WT versus Zeb1iΔEC mice (5 mice each). Comparison of p-SMAD2/3 expression in vessel-excluded areas at the indicated tumors is shown in F (right). (G) ELISA for secreted TGF-β1, TGF-β2, and TGF-β3 levels in whole lysates of LLC tumors dissected from Zeb1WT and Zeb1iΔEC mice (n = 3 independent experiments). All data are represented as mean ± SD. *P < 0.05; **P < 0.01. Differences were tested using unpaired 2-sided Student’s t test.

