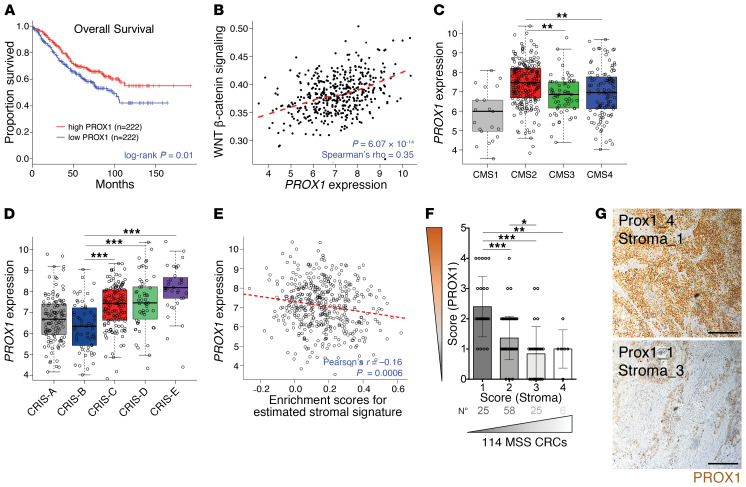
Figure 1. High PROX1 expression is associated with better clinical outcomes and low stromal content.
(A) Kaplan-Meier overall survival curves for patients with high or low PROX1 levels in MSS CRC tumors (GEO GSE39582; n = 444). Progression-free survival showed the same trend but did not reach significance (P = 0.3). (B) PROX1 expression correlation with WNT pathway activation in MSS CRCs (GSE39582; n = 444). Dashed line indicates the locally estimated scatterplot smoothing (LOESS) fit. (C) PROX1 expression in CRC CMS subgroups (GSE39582; n = 409). CMS1 MSI-like (n = 21); CMS2 high WNT signaling (n = 217); CMS3 KRAS-mutant and metabolic alterations (n = 63); CMS4 TGF-β–driven stromal and angiogenic activation (n = 108). P < 0.001, by 1-way ANOVA with Tukey’s multiple comparisons test. P < 0.001, for CMS2 verus CMS1; P = 0.001, for CMS2 versus CMS3; P = 0.003, for CMS2 versus CMS4. (D) PROX1 expression in intrinsic CRIS subtypes. CRIS-A: BRAF- or KRAS-mutated, secretory (n = 88); CRIS-B TGF-β signaling, EMT features (n = 59); CRIS-C KRAS WT, high ERBB/EGFR pathway activity, MYC copy number gains (n = 119); CRIS-D: high WNT, IGF2 amplification, and FGFR autocrine stimulation (n = 96); CRIS-E: high WNT, Paneth-like phenotype, and TP53-mutations (n = 82) in GSE39582 (n = 444). P < 0.001, by 1-way ANOVA with Tukey’s multiple comparisons test. (E) PROX1 expression negatively correlated with a tumor stromal signature in MSS CRCs (GSE39582; n = 444). The stromal gene signature is from ref. 80. Enrichment was computed using single-sample GSEA (81). Dashed line indicates the linear regression fit. (F) Scatterplot of the negative correlation between scores for PROX1 protein nuclear expression levels in tumor cells and for stromal content over the total tumor area, in MSS primary CRC samples (n = 114). (G) Representative images of CRC adenocarcinomas with high and low PROX1 scores. PROX1 staining (brown) and DNA counterstaining (blue) are shown. Scale bars: 200 μm.

