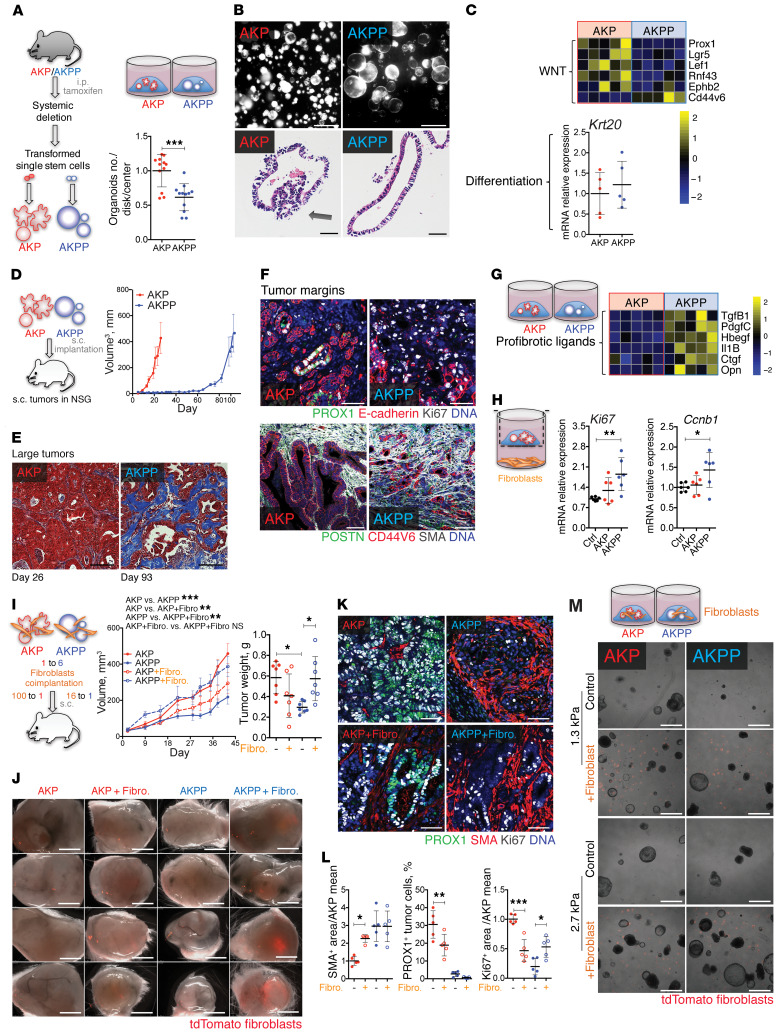
Figure 3. Prox1 loss generates desmoplastic tumors in the presence of activated Kras.
(A) Reduced clonogenic capacity of Prox1–/– intestinal stem cells. Apcfl/fl KrasLSL-G12D Tp53fl/fl villin-CreERT2 (AKP) and Apcfl/fl KrasLSL-G12D Tp53fl/fl Prox1fl/fl villin-CreERT2 (AKPP) organoids (n = 12 per genotype). (B) AKP and AKPP organoids. Upper row shows Matrigel disks with organoids. Scale bars: 1.2 mm. Lower row shows H&E-stained organoid sections. Scale bars: 20 μm. Arrow indicates epithelial polarization loss. (C) WNT signaling and differentiation in AKP and AKPP organoids. Graph shows qRT-PCR for the indicated genes, and data are presented in a heatmap (n = 5). (D) PROX1 loss delayed tumor development. Mice were injected s.c. with 50 AKP or AKPP organoids. AKP, n = 5; AKPP, n = 6. (E) Masson’s trichrome staining of advanced tumors. Scale bars: 50 μm. (F) Increased stromal reaction and invasion in AKPP tumor margins. Images in top row show staining for PROX1 (green), E-cadherin (red), Ki67 (white), and DNA (blue). Images in bottom row show staining for POSTN (green), CD44V6 (red), α-SMA (white), and DNA (blue). Scale bars: 50 μm. (G) AKPP organoids produced profibrotic factors. Heatmap of the indicated genes (n = 5). (H) AKPP organoids promoted fibroblast proliferation. Ki67 and Ccnb1 expression by qRT-PCR. Data were normalized to the control mean (n = 6). (I) Tumor growth curves and weights. Mice were implanted with 50 AKP or 300 AKPP organoids ± 5000 tdTomato+ intestinal fibroblasts (Fibro.) (n = 7). (J) AKPP cells sustained fibroblasts. Images show control and tdTomato+ (red) fibroblast–coinjected tumors. Scale bars: 2 mm. (K) Fibroblast coimplantation effects on tumor desmoplasia, PROX1 expression, and cell proliferation. Images show staining for PROX1 (green), α-SMA (red), Ki67 (white), and DNA (blue). Scale bars: 50 μm. (L) Quantification of the data shown in K. α-SMA+ and Ki67+ areas were normalized to the total tumor area and the AKP mean. (M) Fibroblast and tissue stiffness effect on organoids. Organoids with or without tdTomato+ fibroblasts in hydrogels with normal mucosa (1.3 kPa) or tumor (2.7 kPa) stiffness. Scale bars: 1.2 mm. *P ≤ 0.05, **P ≤ 0.01, and ***P ≤ 0.001, by Student’s t test (A and C) or 1-way (H and L) or 2-way (I) ANOVA with Tukey’s multiple comparisons test, scatterplot, or mean ± SD.

